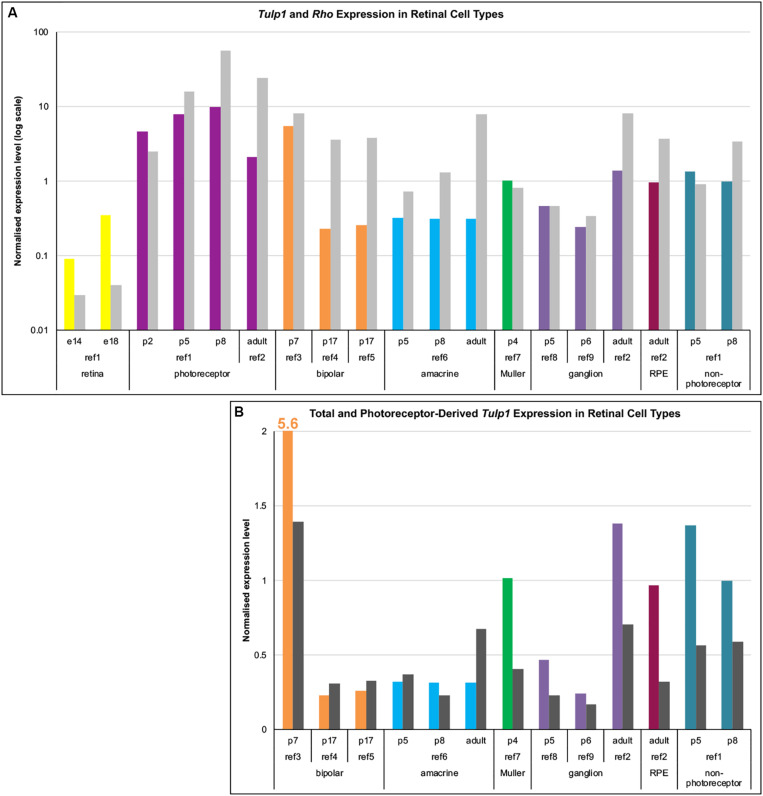
FIGURE 2.
Expression analysis of Tulp1 in retinal cell types. Raw expression data were obtained from GEO (NCBI) using GSE71462 (ref1), GSE19304 (ref2), GSE127771 (ref3), GSE80232 (ref4), GSE81903 (ref5), GSE33088 (ref6), GSE86199 (ref7), GSE115404 (ref8), GSE90652 (ref9) data sets. Expression levels were normalized using the average expression of 17 housekeeping genes. (A) Normalized expression values of Tulp1 (color coded for different cell types) and Rho (gray) from various retinal cell type samples are given in a bar chart. (B) The total (color coded for different cell types) and the photoreceptor component (dark gray; estimated using Rho expression) of Tulp1 expression in various samples is given in a bar chart.

