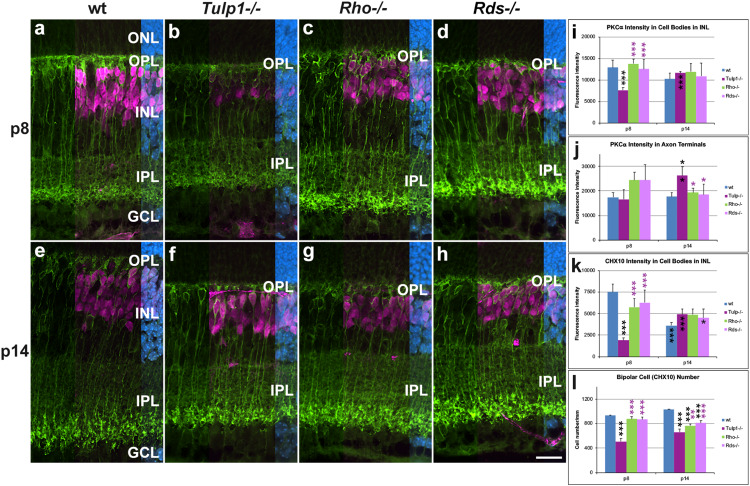
FIGURE 3.
Bipolar cells detected with PKCα and CHX10 immunocytochemistries. (a–h) Retinal sections from wt, Tulp1-/-, Rho-/-, and Rds-/- mice at p8 and p14 (n = 6) were co-labeled with PKCα (green) and CHX10 (purple, overlaid on the right) and counterstained with DAPI (blue; overlaid on the far right). CHX10 labels all bipolar cell bodies while PKCα labels rod bipolar cells only. Fluorescence label intensities and cell numbers were determined in microscope images using cellSens software and results are given in bar charts; bars represent mean + SD. (i,j) PKCα intensity in the cell bodies and in axon terminals in inner plexiform layer (IPL), respectively (n = 4). (k) CHX10 intensity in cell bodies (n = 4). (l) Quantification of CHX10-positive cells (n = 6). ONL: outer nuclear layer, OPL, outer plexiform layer; INL, inner nuclear layer; GCL ganglion cell layer. Scale bar (h): 20 mm. *p < 0.05; **p < 0.01; ***p < 0.001 (ANOVA). Black stars above bars refer to differences between IRD and wt mice, purple stars above bars refer to differences between Tulp1-/- and the other IRD mice; black stars within bars refer to a difference compared to the previous time point.

