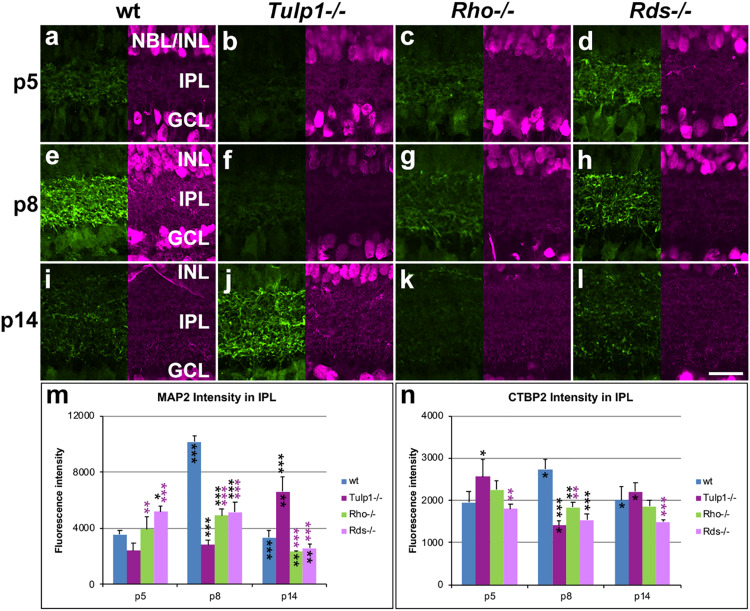
FIGURE 6.
Inner plexiform layer (IPL) and ganglion cells. Retinas from wt, Tulp1-/-, Rho-/-, and Rds-/- mice were taken at p5, p8, and p14 (n = 5–6). (a–l) Sections were co-labeled with MAP2 (left; green) and CTBP2 (RYBEYE; right; purple) immunocytochemistries. MAP2 (n = 3; m) and CTBP2 (n = 3; n) label intensities in the inner plexiform layer (IPL) were quantified from microscope images using cellSens software and results are given in bar charts; bars represent mean + SD. INL, inner nuclear layer; NBL, neuroblast layer. Scale bar (l): 20 mm. *p < 0.05; **p < 0.01; ***p < 0.001 (ANOVA). Black stars above bars refer to differences between IRD and wt mice, purple stars above bars refer to differences between Tulp1-/- and the other IRD mice; black stars within bars refer to a difference compared to the previous time point.

