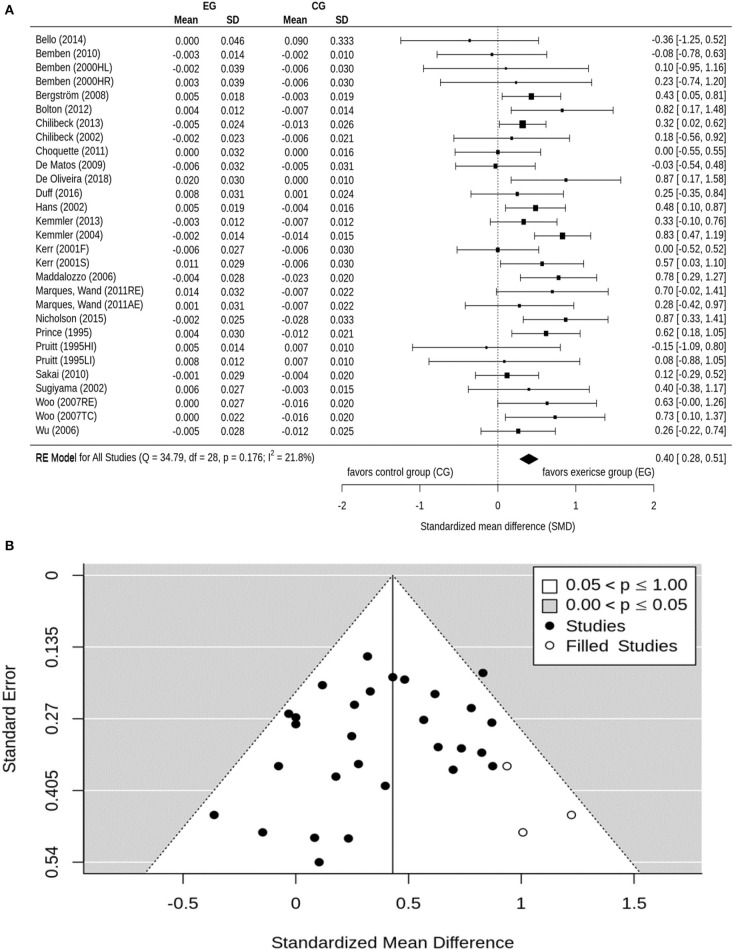
Figure 4.
(A) Forest plot of meta-analysis results at the total hip. The data are shown as pooled standard mean difference (SMD) with 95% CI for changes in exercise and control groups. (B) Funnel plot of total hip BMD with Trim and Fill. SE, standard error of standardized mean difference; SMD, standardized mean difference.

