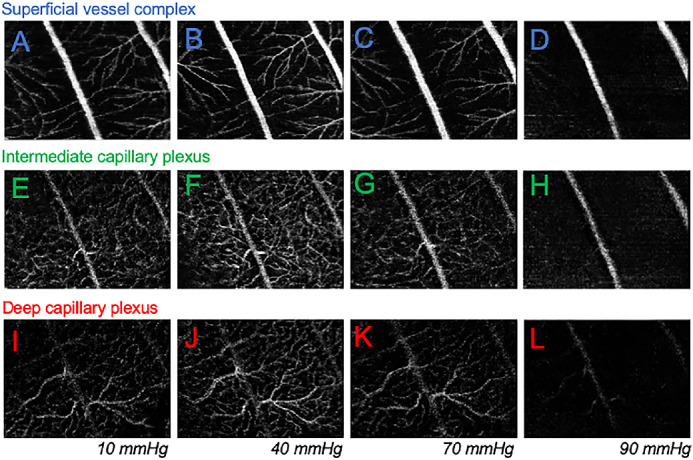
Figure 3.

Effect of IOP elevation on vessel layers in a representative rat eye. (A−D) The SVC for the same eye when IOP was at 20, 40, 70, and 90 mm Hg. (E-H) Effect of IOP elevation on the ICP for the same eye. (I-L) Effect of IOP elevation on the DCP for the same eye.
