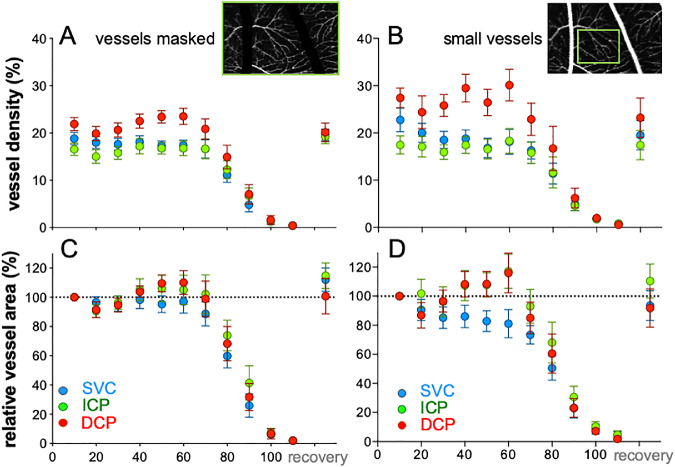
Figure 4.
IOP elevation affects the superficial vessel differently to the deeper layers. (A) Group average (±SEM, n = 14) relative vessel area for the entire region of interest (20 × 10°) analyzed after masking the large vessels, plotted as function of IOP for the SVC, ICP, and DCP. (B) Relative vessel area for 5 × 5° regions of interest that do not contain large vessels to minimize confound associated with projection artifacts.

