Figure 6.
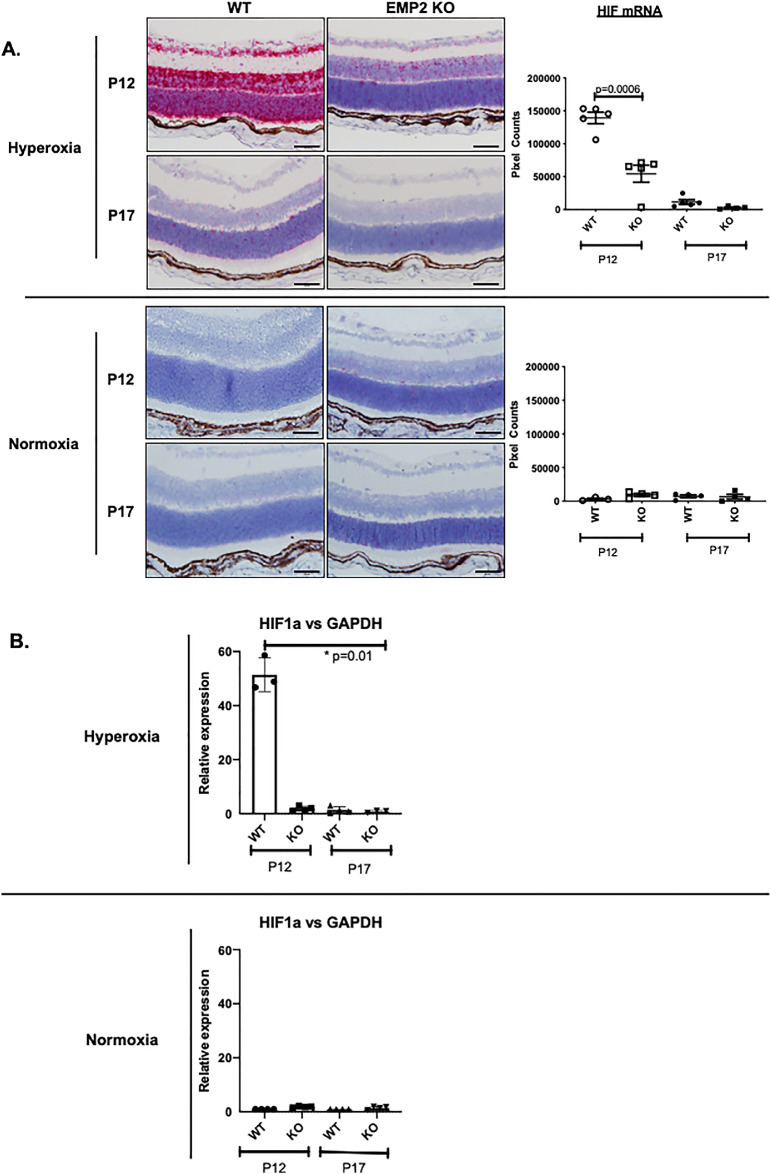
WT but not Emp2 KO mice demonstrate dramatic upregulation of Hif1α mRNA expression in retinal neuronal layers in murine OIR at P12. (A) Representative images taken using RNA in situ hybridization assays demonstrate high Hif1α mRNA expression in OIR conditions in WT but not Emp2 KO mice at P12 (P = 0.0006) (top row). At P17, no significant difference in Hif1α mRNA expression is seen between the WT and Emp2 KO OIR mice (second row). Minimal Hif1α mRNA is expressed under normoxic conditions (third and fourth row). Data are graphically summarized as mean average pixel count/area of interest ± SEM (N = 3−5 per group). Scale bars represent 50 µm. (B) Validation of Hif1α mRNA expression in OIR (top graph) and normoxia (bottom graph) conditions by qRT-PCR demonstrates an approximately 50-fold upregulation of Hif1α mRNA expression in WT OIR mice at P12 compared with Emp2 KO OIR mice at P12 as well as both WT and Emp2 KO OIR mice at P17 (P = 0.01). Asterisk indicates P < 0.05.

