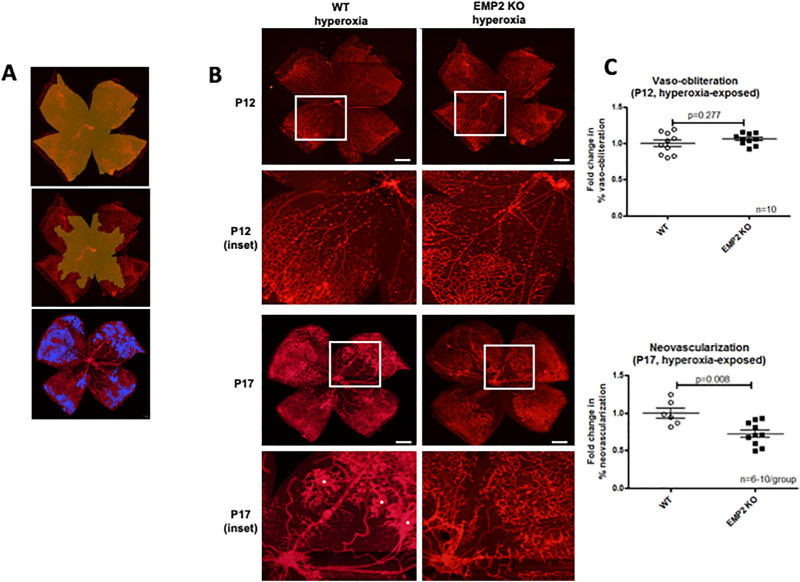
Figure 8.
EMP2 KO mice demonstrate attenuated neovascularization at P17 in murine OIR. (A) Demonstrative whole mount images depicting how areas for quantification were generated in Photoshop. In the top image, the yellow area represents the area included for calculation of total retinal area. In the middle image, the yellow area represents the area included for calculation of vaso-obliteration. In the bottom image, the blue areas indicate areas of neovascularization. (B) Representative whole mount images demonstrating no change in vaso-obliteration at P12 (top row), with enlarged insets (second row), but decreased severity of neovascularization at P17 (third row), with enlarged insets (fourth row) in Emp2 KO mice (right column) compared with WT mice (left column). Red staining for lectin outlines endothelial cells lining retinal vasculature. Asterisks indicate areas of neovascularization. Scale bars represent 500 µm. (C) Graphs representing quantification of vaso-obliteration at P12 (top) showing no difference between WT and Emp2 KO groups (P = 0.277; N = 10−11/group), but decreased fold change in neovascularization at P17 (bottom) in Emp2 KO mice (P = 0.008; N = 6−10/group). Data are represented in graphs as mean ± SEM.

