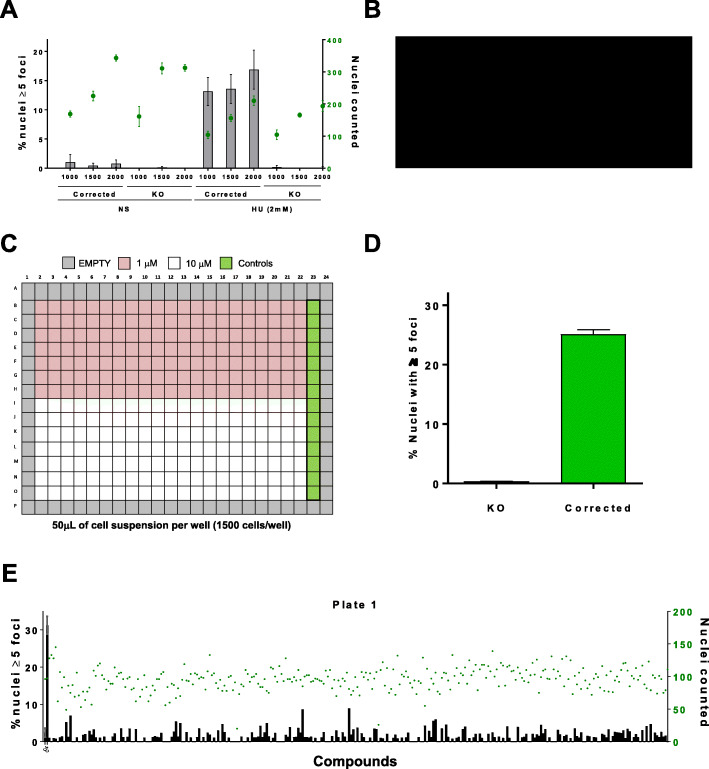
Fig. 2.
High content screening setup. a FANCA-deficient (KO) and corrected cells stably transfected with YFP-FANCD2 were plated at different concentrations, left untreated or treated 24 h with 2 mM HU. Fluorescent images were obtained on Image Express Microscopy and nuclear counts or nuclear foci detected with CellProfiler 2.0 software (see materials and methods). Grey bars (left legend) show percentage of cells with 5 or more nuclear foci. Green dots (right legend) show nuclei counted from 6 average images captured for each well. Graph shows mean +/− SD of three replicates. b Library collections used in the screening. c Drug layout on 384 well plates used in the screening. Violet wells, 1 μM drug treatment, white wells, 10 μM. Green wells, positive controls (top six wells, FANCA-deficient cell line, bottom six wells, FANCA-corrected cell line). Grey wells that come from the plate edges where left empty to avoid sample evaporation. d Percentage of nuclei with 5 or more foci from control samples on each plate. e Representative graph from a 384 well plate with percentage of cells with foci (black bars, left legend) analyzed with CellProfiler 2.0 software, in parallel with nuclear count (green dots, right legend) to show potential drug toxicity

