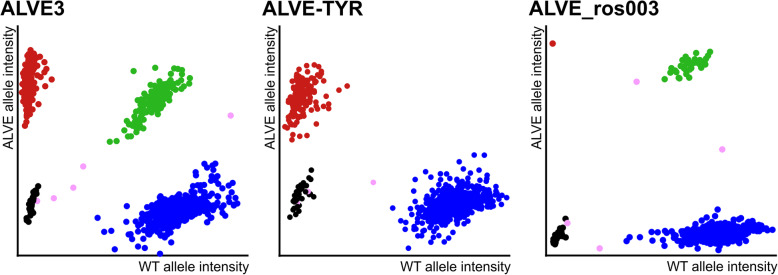
Fig. 2.
High-throughput genotyping of ALVE integrations by KASP assay. Genotype calls are based on relative intensity of the fluorescent tags conjugated to the wildtype and ALVE integration specific primers, with each dot representing a single chicken DNA sample. Red points (top left) represent individuals homozygous for the ALVE integration, blue points (bottom right) for individuals homozygous for the wildtype allele, and green points (top right) are heterozygotes. Black points are sample negative controls and pink points are ambiguous samples either due to their location outside genotype clusters, or their relative fluorescence positions at earlier cycle stages. Three plots are shown as examples, with all twenty in Fig. S4. ALVE3 shows high numbers of individuals in all three genotypes. ALVE-TYR is fixed in both WPR lines and absent in all WLs and the RIR (hence no heterozygotes). Homozygous individuals for ALVE_ros003 were rare, so genotype confidence was derived by pooling data from multiple generations (not shown)

