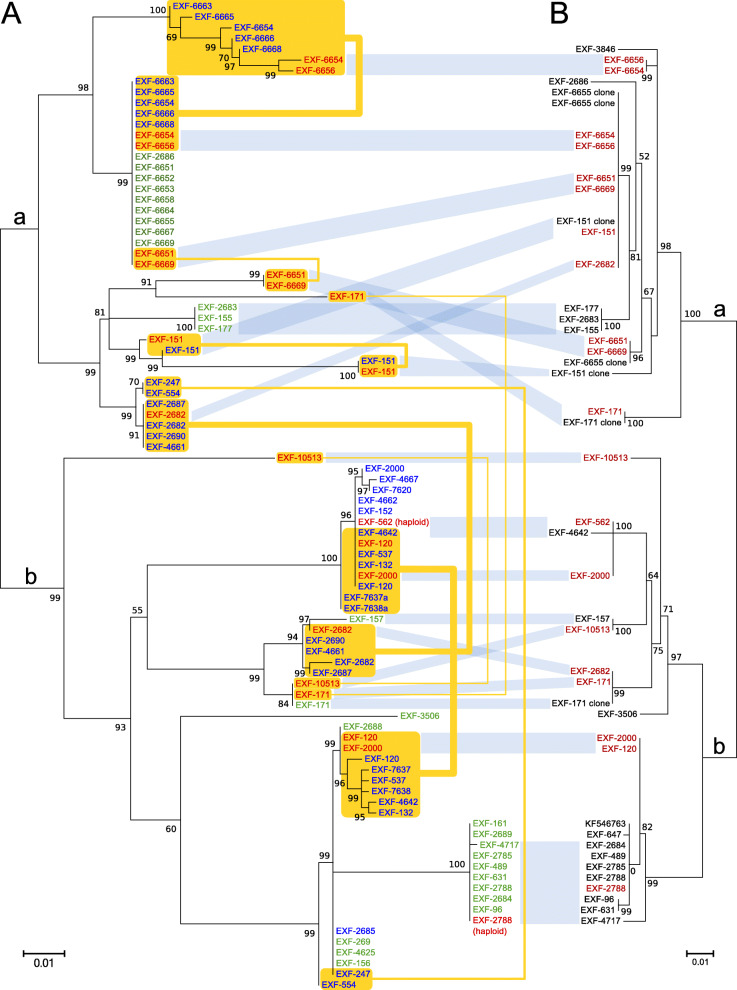
Fig. 4.
Maximum likelihood phylogenies based on the MCM7 and BTB genes. a The MCM7 gene. The amplicons were amplified by PCR and sequenced by Sanger sequencing. Sequence names without ambiguous nucleotides after sequencing are shown in green. Haplotype estimation was used to separate haplotypes from sequences with ambiguous nucleotides (in blue). Estimated haplotypes with identical phylogenetic positions were collapsed into one sequence. Haplotype sequences recovered from the whole-genome sequences are included for comparison (in red). Haplotype pairs from the same genomes are connected by yellow lines. b The BTB gene. Only sequences without ambiguous nucleotides and sequences obtained by cloning the amplicons and sequencing individual clones were included in the analysis. Haplotype sequences recovered from the whole-genome sequences are included for comparison (in red). The large phylogenetic clusters observed in both the MCM7 and BTB phylogenies are indicated with ‘a’ and ‘b’

