. 2020 May 5;296(1):134–142. doi: 10.1148/radiol.2020191904

Figure 4:

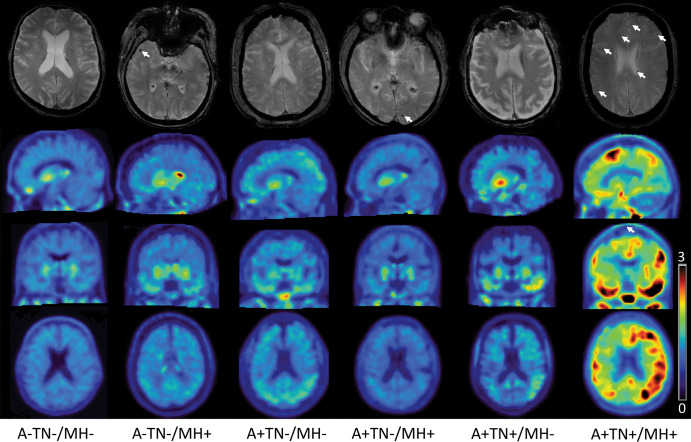
Images in representative participants from each amyloid β/tau/neurodegeneration (ATN) group. The upper row shows axial T2* gradient-echo images with (arrows) and without microhemorrhage. The second, third, and fourth row show sagittal, coronal, and axial fluorine 18–labeled flortaucipir tau PET standardized uptake value ratio (SUVR) images, respectively, normalized to cerebellum gray matter in a SUVR range 3–0. A+ = amyloid β positive, A− = amyloid β negative, TN+ = tau/neurodegeneration positive, TN− = tau/neurodegeneration negative, MH− = microhemorrhages absent, MH+ = microhemorrhages present.

Images in representative participants from each amyloid β/tau/neurodegeneration (ATN) group. The upper row shows axial T2* gradient-echo images with (arrows) and without microhemorrhage. The second, third, and fourth row show sagittal, coronal, and axial fluorine 18–labeled flortaucipir tau PET standardized uptake value ratio (SUVR) images, respectively, normalized to cerebellum gray matter in a SUVR range 3–0. A+ = amyloid β positive, A− = amyloid β negative, TN+ = tau/neurodegeneration positive, TN− = tau/neurodegeneration negative, MH− = microhemorrhages absent, MH+ = microhemorrhages present.