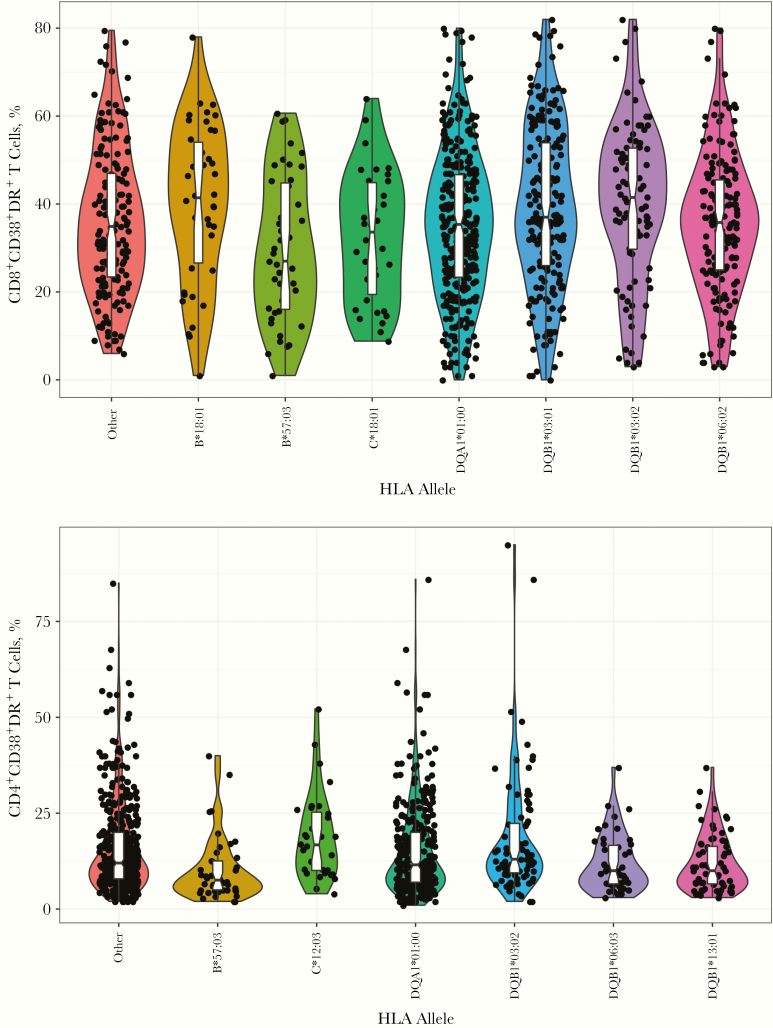
Figure 2.
Violin plots showing percentages of CD8 and CD4 T-cell activation for each patient by HLA allele. Distributions of percentages of CD8+CD38+DR+ and CD4+CD38+DR+ T cells are shown by allele variant group. For plots of the allele variants, each point represents a unique subject. Activation levels at multiple visits were averaged for each subject. The “Other” group includes subjects with none of the allele variants.

