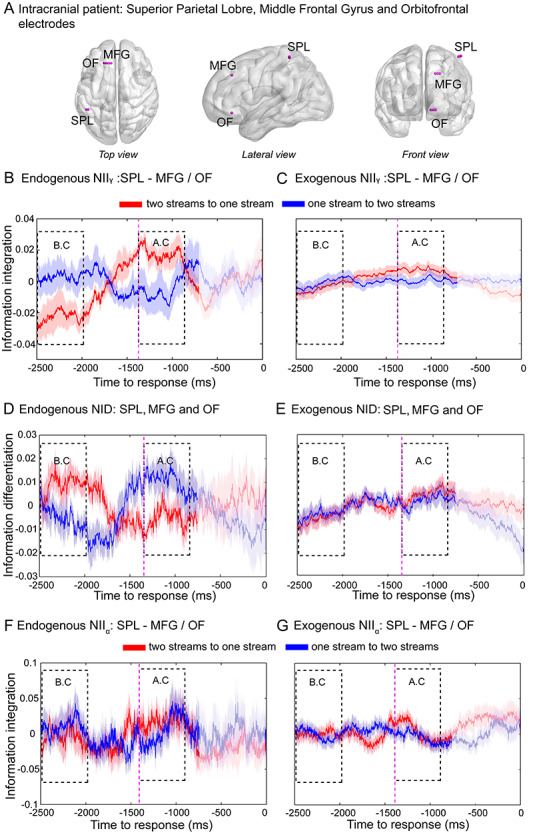
Figure 4.

Frontoparietal NII and NID in intracranial recordings. (A) Electrodes were implanted in the left SPL, left MFG and left OF (Table 1). Representative pair of electrodes (SPL-MFG) showing NIIγ and NID of transitions from the two-stream to the one-stream percept (red line) and from the one-stream to the two-stream percept (blue line) in the endogenous (B,D) and exogenous (C,E) conditions, respectively. Frontoparietal NII in the alpha band (NIIα) in intracranial recordings for the endogenous (F) and exogenous conditions (G). Purple dashed line marks the mean RT (1380 ms) of the exogenous (control) condition of the intracranial data. Statistical analyses were performed as explained in Figure 2. Shaded bars represent SEM.
