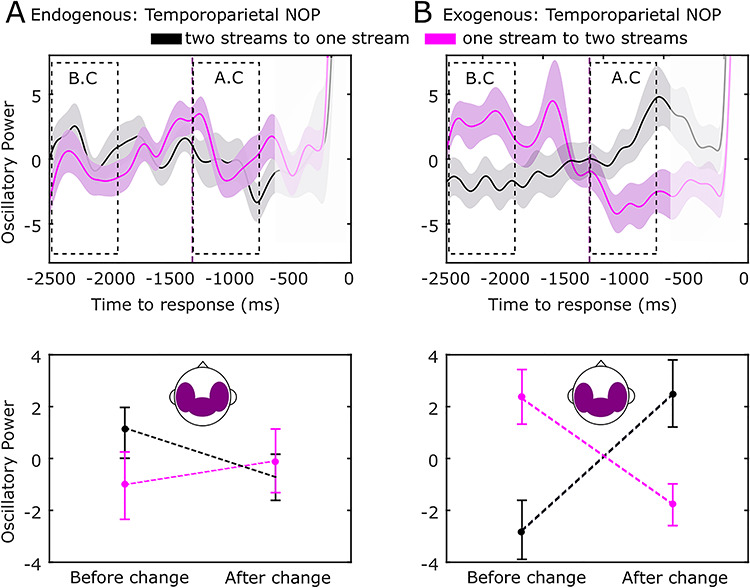
Figure 6.

Temporoparietal NOP in the gamma range dissociates alternative exogenous percepts. Neural dynamics of NOP from the two-stream to the one-stream percept (black line) and from the one-stream to the two-stream percept (purple line) for the endogenous (A) and exogenous (control) conditions (B). Purple dashed line marks the mean RT (1342 ms) of the exogenous (control) condition. Statistical analysis was performed as described in Figure 2. Shaded bars (top row) and error bars (bottom row) represent SEM.
