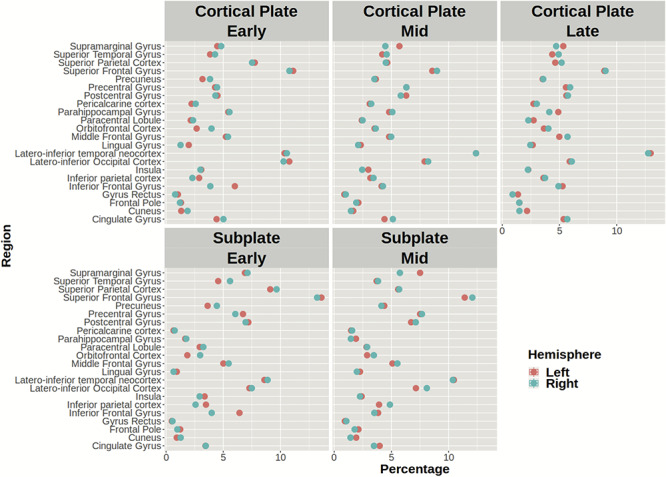
Figure 1.

The average regional volume fraction of the CP (upper row) and SP (lower row) in the left (red circle) and right hemisphere (blue circle) during early, mid-, and late prenatal periods. Note that the mean volume percentage of CP and SP for each region is similar across periods.
