
Figure 1.
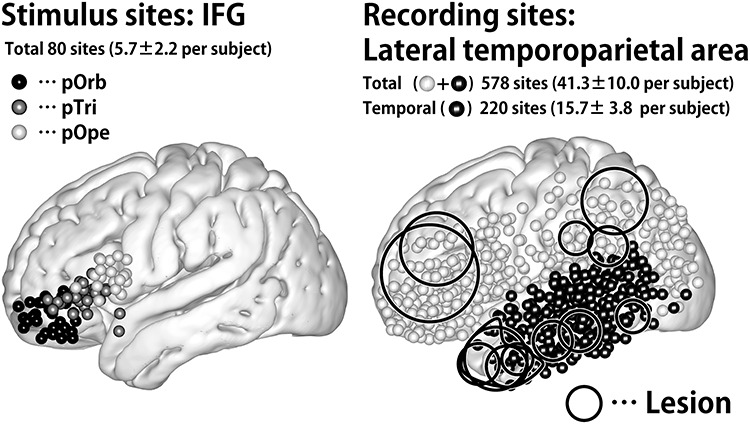
Distribution of stimulus and recording sites. (Left) Shown are the stimulus sites in all patients plotted in MNI space. The coordinate of a stimulus site was defined as the midpoint of the stimulation electrode pair. The black, gray, and white spheres indicate the location of the stimulus sites in IFG pOrb, pTri, and pOpe, respectively. (Right) The recording sites in all patients plotted as spheres in MNI space. The black spheres indicate sites in the temporal lobe, and the white ones indicate those out of the temporal lobe in individual brains. The circles indicate the location of the lesions, removal of which was the indication for surgery. The lesions are widely distributed in the frontal, parietal, and temporal opercula except for the insular cortex because we excluded those patients who had a lesion or intense edema in the temporal stem.