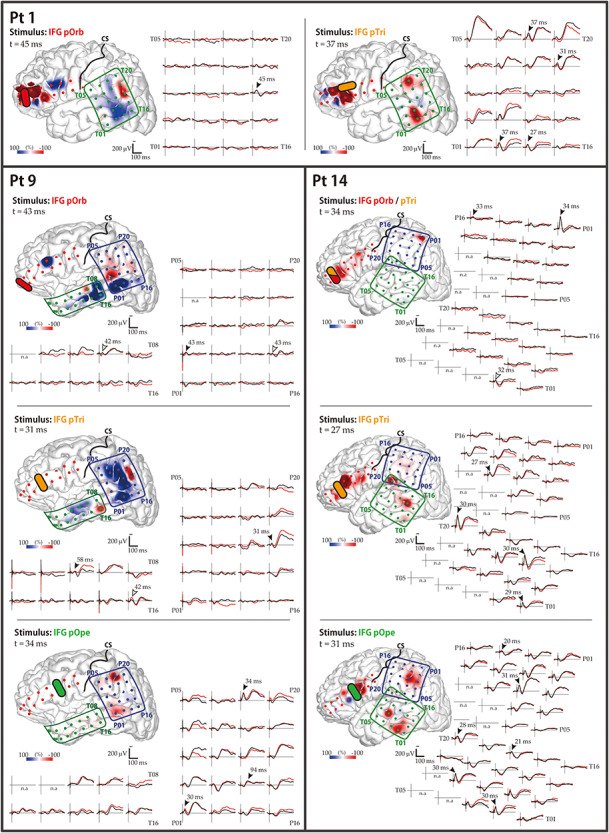
Figure 5.

CCEP responses to IFG stimulation: parietal lobe. Shown are the data for the three patients (1, 9, and 14) who showed frontoparietal connectivity. The waveforms in the temporal and parietal grids are shown. The black and red waveforms show the average evoked potential from two consecutive sessions. The black arrowheads indicate the maximal N1 response sites automatically extracted from the CCEP database. The white arrowheads indicate the maximal N1 sites added by visual inspection, which were missed by the automatic algorithm due to poor reproducibility. The brain surface models show the spatial distribution of the early-phase response amplitudes, measured at the peak time of the parietal N1 response. The color bar is scaled to the maximal amplitudes of the parietal N1 responses in each panel. Yellow bars indicate the stimulation electrode pairs; “CS” and black lines, the central sulcus. Electrode numbers are shown at grid corners.
