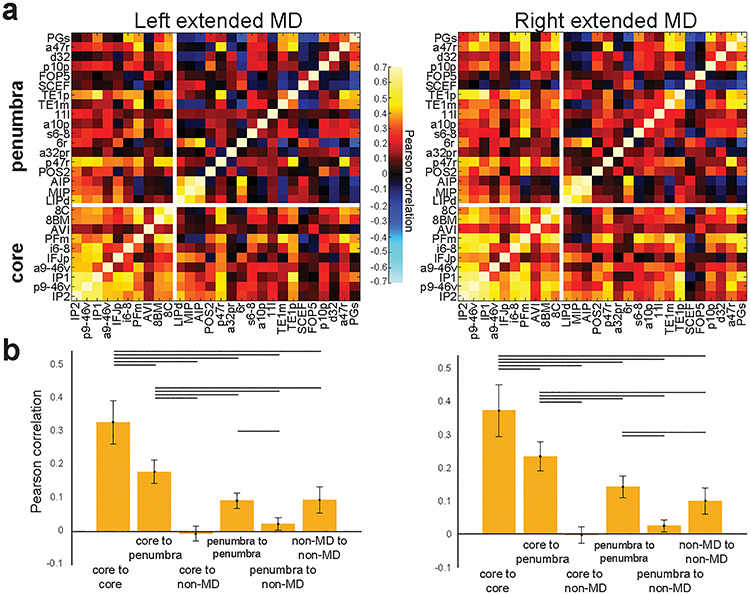
Figure 3.

FC of the MD system. (a) FC (Pearson correlation) across the MD system. Regions of the extended MD system are separated into core and penumbra, with regions within each set ordered by mean activation (beta) across our three functional contrasts. Note the strength of core MD connectivity (lower left box) versus penumbra connectivity (upper right box). (b) Statistical comparison (paired sample t-test) between different groups of cortical connections. Lines highlight a statistically significant difference (P < 0.05, Bonferroni corrected for 30 comparisons). Data available at http://balsa.wustl.edu/jjL1x.
