
Figure 1.
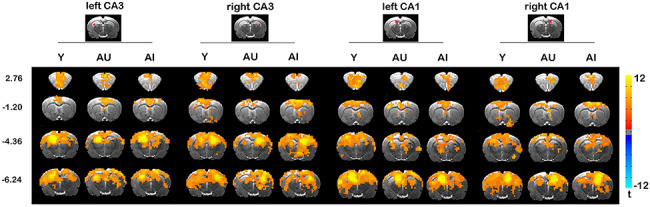
Resting-state functional connectivity maps of left and right CA1 and CA3 hippocampal subdivisions for Y (n = 12), AU (n = 9), and AI (n = 12) rats. P < 0.05 by one-sample t-test, corrected for multiple comparisons. Coordinates represent distance relative to bregma (in millimeters).