
Figure 3.
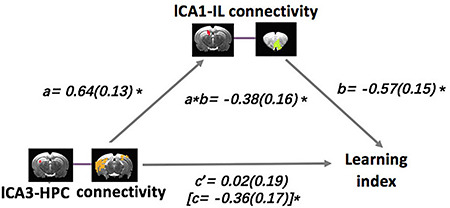
Mediation model for the association between left CA3–HPC connectivity, left CA1–IL connectivity, and learning index, whereby left CA1–IL connectivity is a complete mediator of the relationship between left CA3–HPC connectivity and learning index. Path coefficients are shown next to arrows indicating each link in the analysis, with SEs in parentheses. Path a is the relationship between the predictor and the mediator. Path b is the relationship between the mediator and the outcome. The total effect (path c in square parenthesis) is the relationship between the predictor and the outcome, whereas the direct effect (path c’) is the relationship between the predictor and the outcome controlling for the mediator. Path a*b is the mediation effect. *P < 0.05.