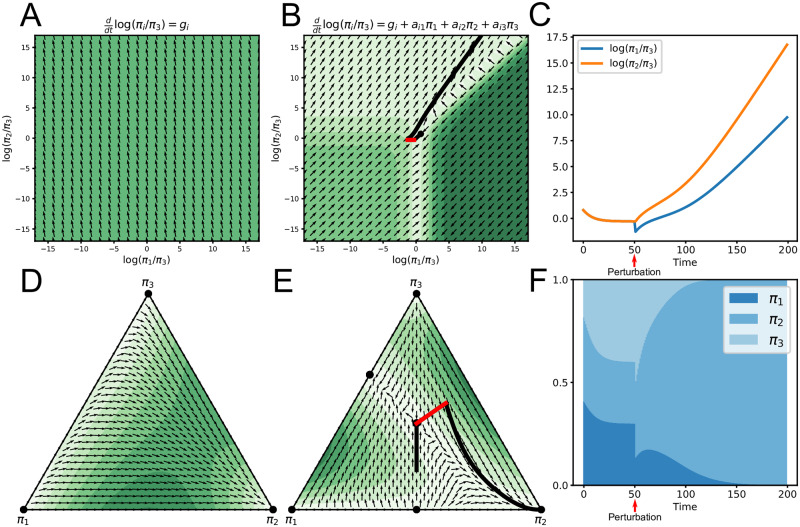
Fig 1. Example phase spaces and trajectories for compositional Lotka-Volterra.
The top row displays examples using the additive log-ratio transformation for three taxa. The bottom row displays examples in relative-abundance space corresponding to the examples in the top row. Arrows display the direction of the gradient, while the colors display its magnitude (lighter is smaller). A) Phase space where dynamics depend on relative growth rates alone. B) Phase space where dynamics depend on growth rates and interactions. The black dot denotes a fixed point. The solid line depicts a simulated trajectory, where an external perturbation (red line) moves the system away from the fixed point. C) Alternate view of the example in B. The red arrow denotes an external perturbation causing the system to move away from the fixed point. D) Phase space in the simplex corresponding to A. Black dots denote fixed points and only occur on the corners. E) Phase space in the simplex corresponding to B. Black dots denote six possible fixed points. The line displays the same simulated trajectory as B. F) Simulation example corresponding to B depicted as relative abundances. An external perturbation at time point 50 causes the system to move away from the fixed point in the interior of the simplex toward one at the boundary.

