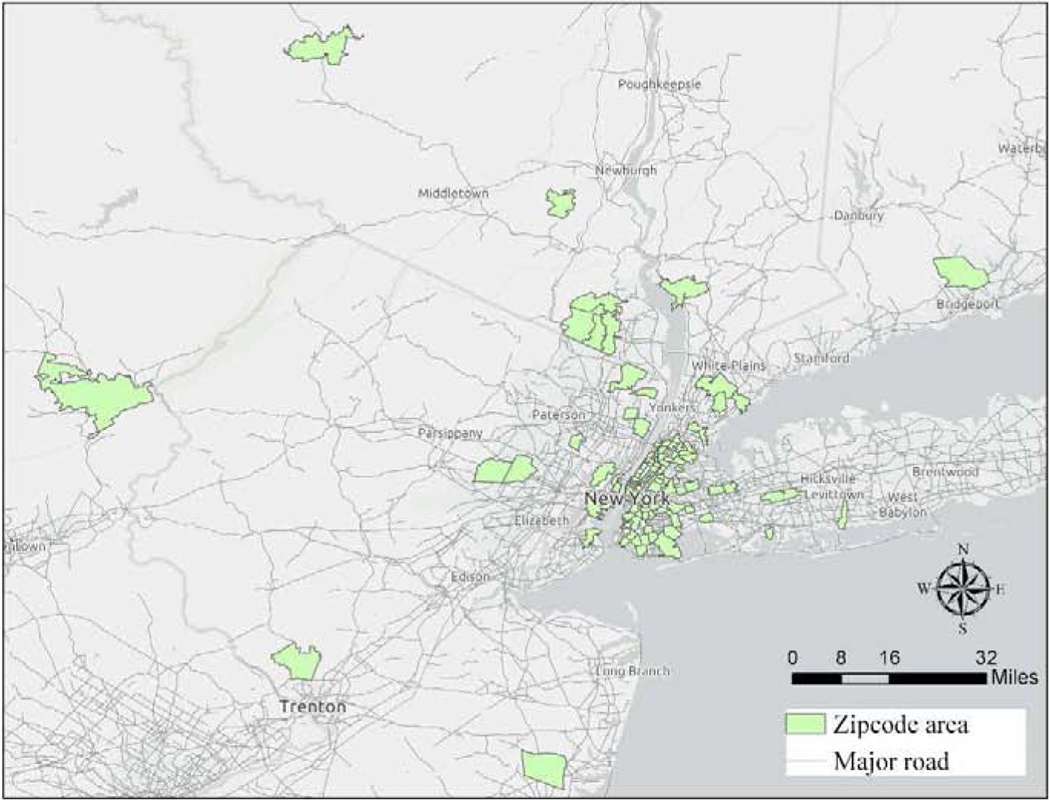
Figure 1.
Geographic Distribution of NICU-HEALTH participants. The highlighted areas are the zipcodes lived by NICU-HEALTH participants. The grey lines show the roads with more than 10,000 annual average daily traffic (AADT). Road data were obtained from the Highway Performance and Monitoring System (HPMS) representing the study year of 2012.

