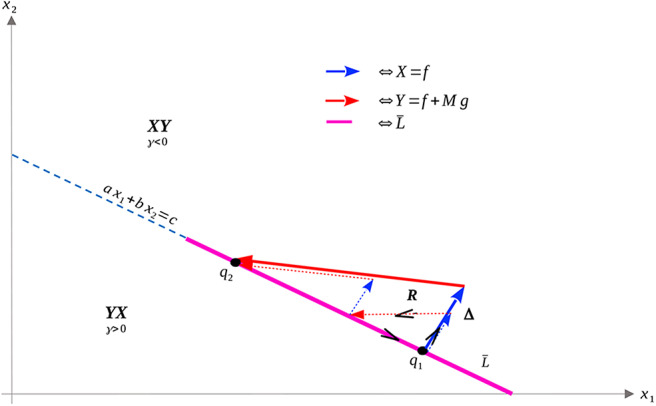
Figure 6.

XY (solid) and XYXY (dashed) trajectories taking q1 to q2 in the region γ > 0. The time difference between the two trajectories can again be related to the surface integral in the region R, where γ < 0. The XY trajectory can then be seen to be slower in comparison.
