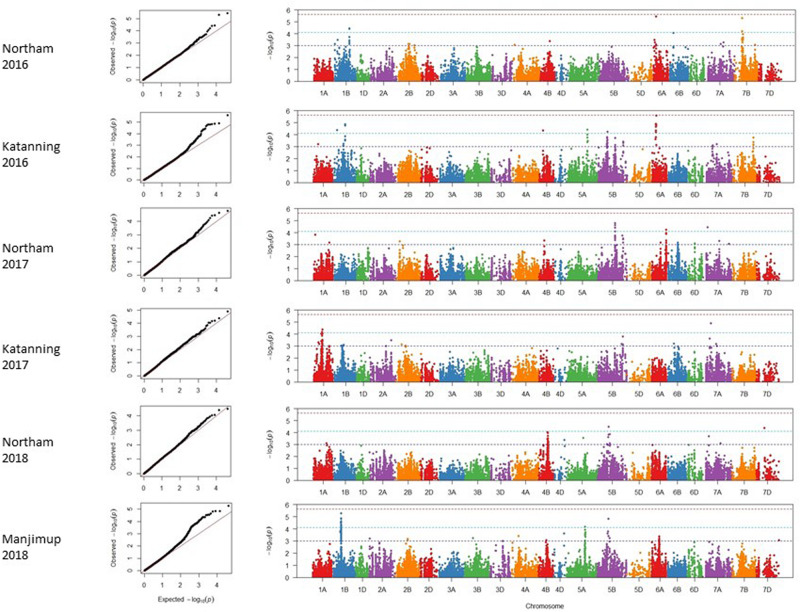
FIGURE 3.
Genome wide association scans for adjusted mean PLAD scores for two locations across 3 years (2016–2018). Q-Q and Manhattan plots are shown to the left and right, respectively. Horizontal dotted lines in each environment represent suggestive (bottom), significant (middle), and highly significant (top) threshold levels for marker-trait associations.

