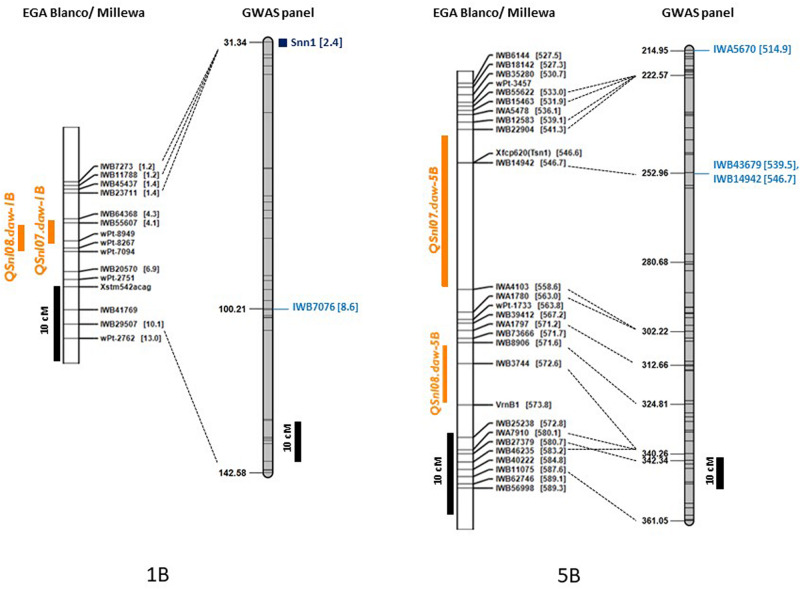
FIGURE 4.
Comparison of maps for chromosomes 1B and 5B with genetic and physical position of QTL detected in the doubled haploid EGA Blanco/Millewa map (Francki et al., 2018) and GWAS panel. Physical location (in Mbp) of SNP are shown in square brackets with common markers anchoring EGA Blanco/Millewa and consensus map (Wang et al., 2014) shown by black dashed lines. QTL for SNB resistance detected in the DH map in 2017 and 2018 are shown in orange and SNP markers detecting QTL on the consensus map are shown in blue. Black bars represent centimorgan distances in the DH and consensus maps.

