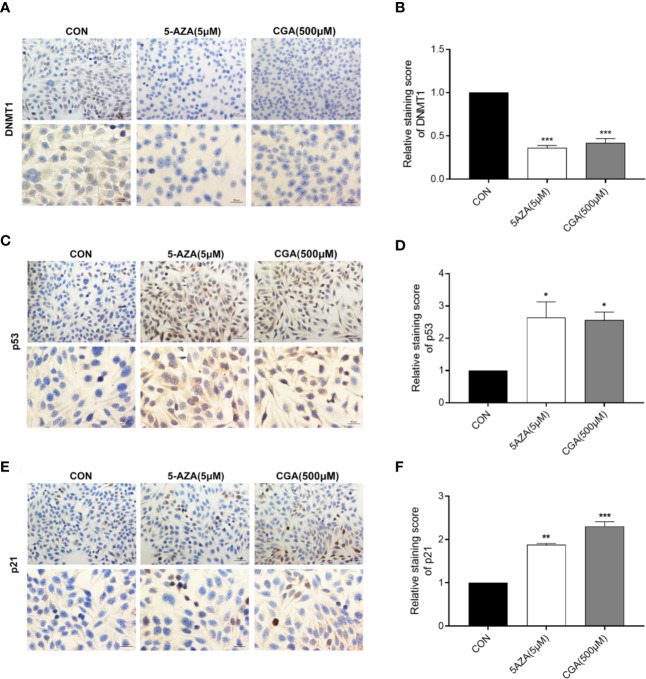
Figure 5.
Immunocytochemical staining intensity after treatment with CGA (250, 500, 1000 μM) and 5-AZA (5 μM) (200 × and 400 × magnification). (A–F) DAB staining showed a considerable decrease in DNMT1 expression and an increase in p53 and p21 expression in the CGA group. *p < 0.05, **p < 0.01, ***p < 0.001. CON, vehicle DMSO control group.

