Figure 3.
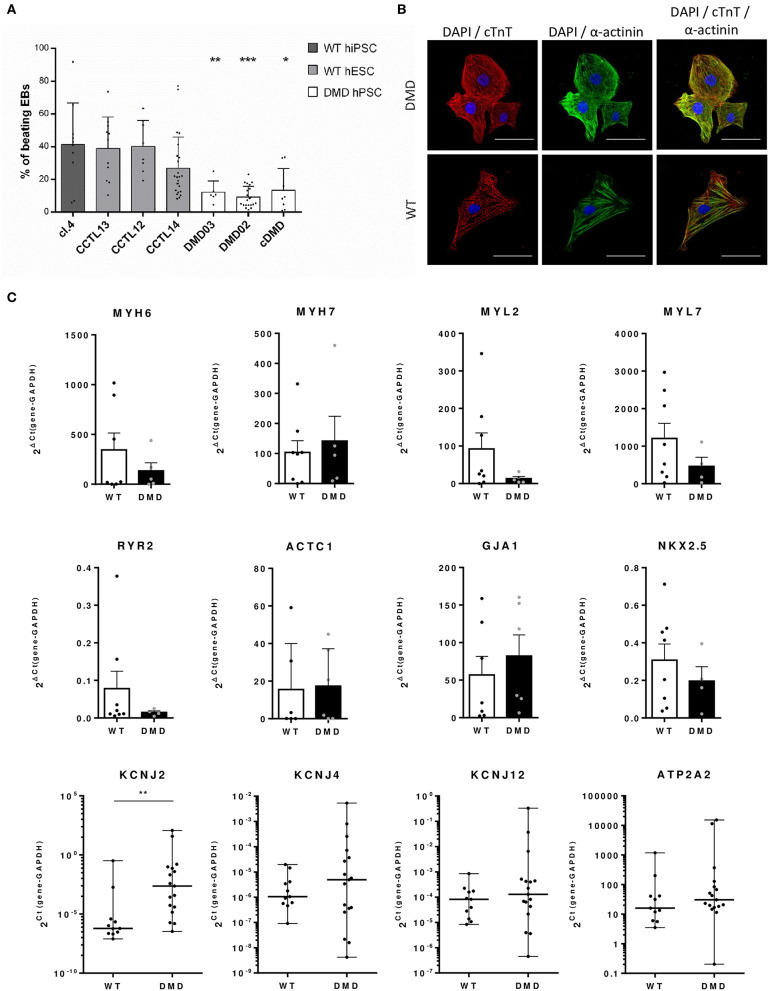
Differentiation efficacy is lower in DMD-hPSC lines. (A) All DMD-hPSC and WT-hPSC lines were differentiated into spontaneously contracting EBs containing cardiomyocytes and cardiac cells. The ratio of these spontaneously contracting clusters was evaluated and compared to wild-type (WT) controls (n = 36 for CCTL14 EBs, n = 8 for CCTL12 EBs, n = 13 for CCTL13, n = 12 for cl.4 EBs, n = 25 for DMD02 EBs, n = 6 for DMD03 EBs, n = 19 for cDMD-EBs). Lesser yields of beating EBs were identified in all DMD-hPSC lines. Statistical difference was calculated by one-way ANOVA and multiple comparison with Dunn's test. Significance (*p < 0.05, **p < 0.01, ***p < 0.01) is visualized as asterisks for the lowest values; for individual p-values, see Supplementary Table 1. (B) EBs were dissociated and cells labeled for cardiac markers α-actinin (in green) and cardiac troponin T (cTnT, in red) (DAPI is labeling the nuclei). WT and DMD-CCs presented similar level of typical striated pattern of sarcomeres. Line represents 50 μm. (C) Differentiation efficacy was evaluated by rt qPCR on mRNA levels of cardiac markers showing only non-significant differences in expression of various markers (MYH6, n = 7 for WT and n = 5 for DMD; MYL2, n = 8 for WT and n = 4 for DMD; MYL7, n = 8 for WT and n = 4 for DMD; RYR2, n = 8 for WT and n = 4 for DMD; ACTC1 n = 6 for WT and n = 5 for DMD; NKX2.5, n = 8 for WT and n = 4 for DMD, ATP2A2, n = 11 for WT and n = 17 for DMD) and non-significant increase in MYH7 (n = 8 for WT and n = 5 for DMD) and GJA1 (n = 7 for WT and n = 6 for DMD). Potassium channels were analyzed using Kir2.x isoforms mRNA expression (KCNJ2 – Kir2.1, KCNJ4 – Kir2.2 and KCNJ12 – Kir2.3, for all n = 11 for WT and n = 17 for DMD). Statistical significance on pooled DMD and pooled WT data sets was calculated using Mann–Whitney test; exact value for each is represented by • in each graph.

