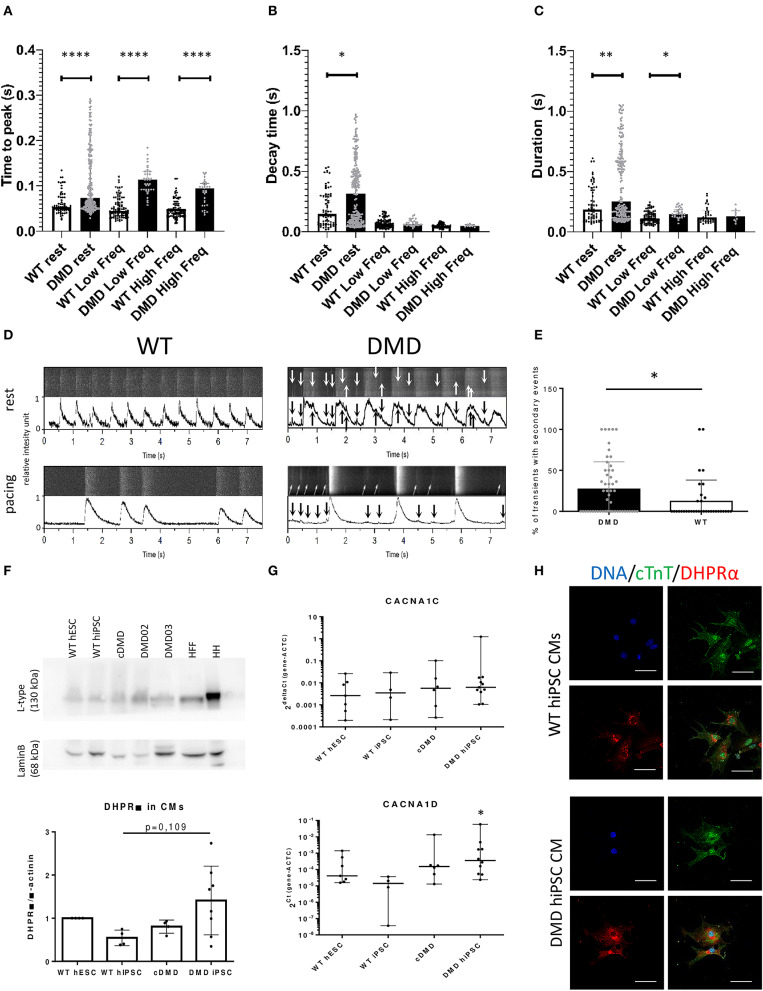
Figure 5.
The dynamics of Ca2+ release and re-pumping is affected by dystrophin deficiency. Release of Ca2+ transients was measured using Fluo4 dyes in enzymatically dissociated DMD (91 cells and n = 278 transients were analyzed for resting conditions; 20 cells and n = 83 transients were analyzed for low frequency paced at 0.5 Hz) and WT-CCs (30 cells and n = 262 transients were analyzed for resting conditions; 15 cells and n = 128 transients were analyzed for low frequency paced at 0.5 Hz) in the age 40–50 days of differentiation. (A) Time to peak, (B) decay time, and (C) contraction duration time were analyzed for the main Ca2+ transients. The DMD-CMs showed significantly higher Ca2+ amplitude and longer time to release and repump/extrude the Ca2+ back into the SR/out of the cell in comparison to WT. The exact values are plotted in the graphs; red line represents the median. Significance (*p < 0.05) is visualized as asterisks as calculated by Mann–Whitney one-sided test (*p < 0.05, **p < 0.01, ****p < 0.0001). The Ca2+ leakage is demonstrated by Ca2+ events of low-amplitude (arrows) among the main Ca2+ transients [D—the obtained data from microscope with line scanning (upper bar) and transferred into peak graph by PeakInspector (lower bar) with and without electrical pacing of 0.5 Hz]. The occurrence of these small events is increased in DMD-CCs transients (E) as analyzed by Mann–Whitney test (n = 54 and n = 35 analyzed cells, for DMD and WT, respectively). (F) L-type channel (DHPR subunit) expression was characterized, showing non-significant increase in protein expression in DMD-hiPSC compared to WT-EBs as calculated by one-way ANOVA (n = 4, n = 4, n = 4 and n = 8 for WT hESC, WT-hiPSC, cDMD, and DMD-hiPSC-EBs). HH was used as positive control, HFF (human foreskin fibroblasts) as non-CM cell sample. (G) CaV isoform's (CACNA1C and CACNA1D) mRNA expression of LTCC subunits were analyzed using rt qPCR showing no difference between the groups. The values were calculated for CMs using ACTC for normalization. At least three biological repetitions were used for the analysis with exact value for each represented by • in the graph. Statistical difference was calculated using one-way ANOVA. (H) ICC analysis showed stronger signal for LTCC (in red) in DMD-hiPSC CCs recognized by cTnT labeling (in green). Line represents 50 μm.

