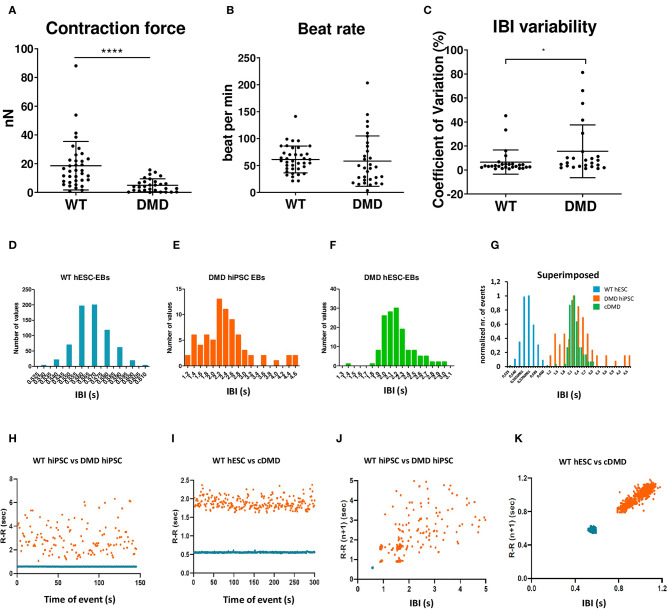
Figure 6.
The spontaneously contracting EBs lacking dystrophin showed weaker contraction force and signs of arrhythmias. The EBs were analyzed by AFM-based methods. (A,B) Contraction force is decreased in DMD-hPSC derived EBs (n = 36 for WT, n = 29 for DMD-EBs), beat rate is not affected by DMD mutation (n = 38 for WT, n = 31 for DMD-EBs). The statistical difference was calculated by Mann-Whitney test (*p < 0.05, ****p < 0.0001). At least five biological repetitions were used in each differentiated line; exact value for each is represented by • in each graph. Beat rate variability was identified in DMD-EBs. Graph shows coefficient of variation analysis (C) of pooled control and DMD groups. The data were cleaned of outliers by ROUT test (q = 1%), and normality was tested by available tests showing non-normal distribution. Statistical difference was calculated using Mann–Whitney test. Representative IBI histograms of control (D, n = 712 peaks of the representative EB analyzed), DMD-hiPSC (E, n = 76 peaks of the representative EB analyzed), and DMD-hESC (F, n = 165 peaks of the representative EB analyzed) EBs and superimposed example of all three groups with normalized values (G). Superimposed representative inter-beat-interval (IBI) scatter plots of control hiPSC with DMD-hiPSC-EBs (n = 145 time points for each EB) (H) and control hESC with DMD-hESC-EBs (n = 334 time points for each EB) (I). Superimposed Poincaré plots of control hiPSC with DMD-hiPSC-EBs (J, same representative EBs as in H) and control hESC with DMD-hESC-EBs (K, same representative EBs as in I).

