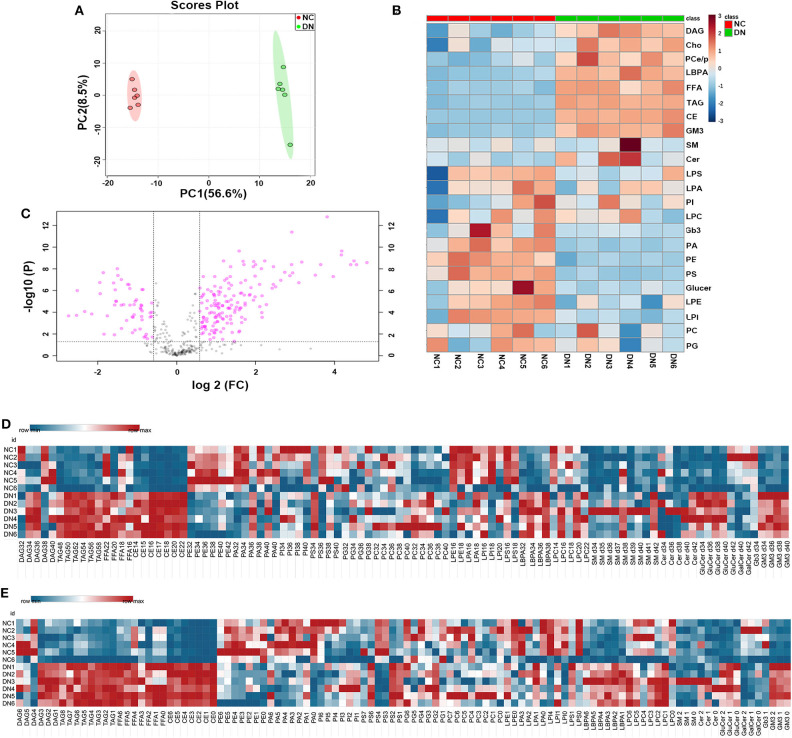
Figure 2.
General analysis of lipidomic profiles in the kidney cortex of diabetic nephropathy (DN) and normal rats. (A) Principal component analysis (PCA) of whole lipidome of the two groups. (B) Volcano plot of all lipid species detected in the two groups. Data are shown as ratios of DN/NC, false discovery rate (FDR) < 0.05, and fold change > 1.5 is highlighted. Heatmap analysis of (C) main lipid class, (D) overall enrichment of chain length for lipid species, and (E) overall quantification of unsaturated bonds for lipid species; n = 6 per group.

