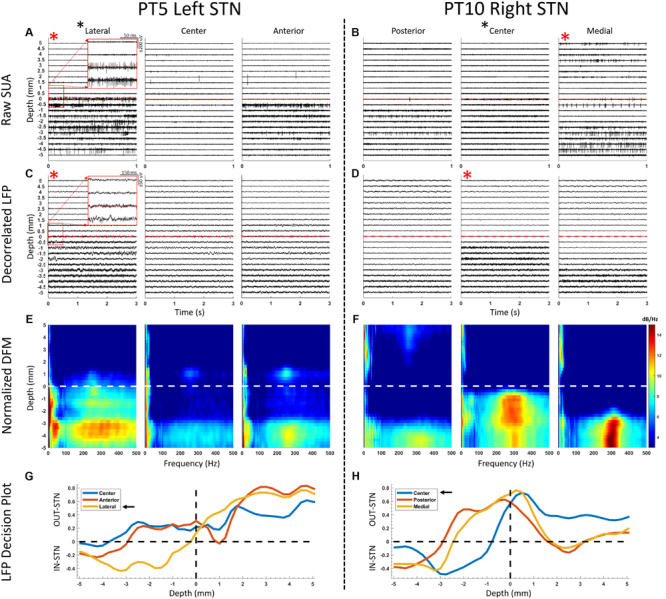
FIGURE 2.

Representative SUA and LFP raw traces and depth-frequency maps (DFM) from two STNs where the suggested track by SUA and LFP overlapped (left panel) and did not overlap (right panel). (A,B) SUA raw traces presented from 5 mm above down to 5 mm below the dorsal border of the STN, with 0.5 mm steps. The dorsal border is marked by an increased spiking and background activity. Red asterisks denote suggested track by the corresponding modality and black asterisk next to the track name denotes the implanted track. (C,D) The decorrelated LFP traces are provided in a similar fashion to SUA traces. Although it can be observed that the oscillatory activity increases after crossing the dorsal border, the nature of the change can be visualized better in the spectral domain where (E,F) DFMs of the corresponding LFPs are presented. The entry to STN is characterized with increased activity in both beta and HFO ranges. (G,H) Decision plots of the classifier voting whether each track is in- or out-STN at each traversed depth. The track with the longest in-STN vote is selected as the implanted track, as indicated with the black arrows. The SUA activity was stronger in the lateral track (A) and the corresponding LFPs agreed (G) in the left panel. On the right panel, SUA (B), which was the decision modality, suggested the medial track. However, after intraoperative imaging validation the lead was placed in the center track, which agreed with the LFP-based decision (H).
