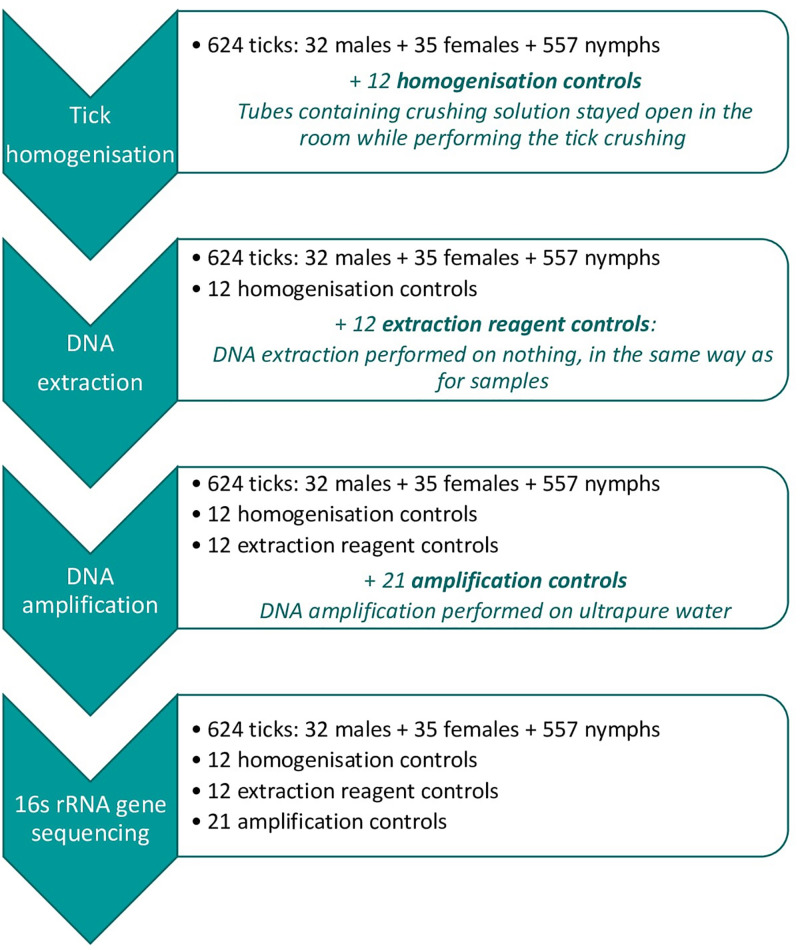
FIGURE 1.
Analyzing process for samples and added controls at each steps: Tick homogenization, DNA extraction, DNA amplification, and 16s rRNA gene sequencing. For each step, information stated in black correspond to the initial sample and potential controls added at a previous step, and blue stated information correspond to the controls added at the present step.

