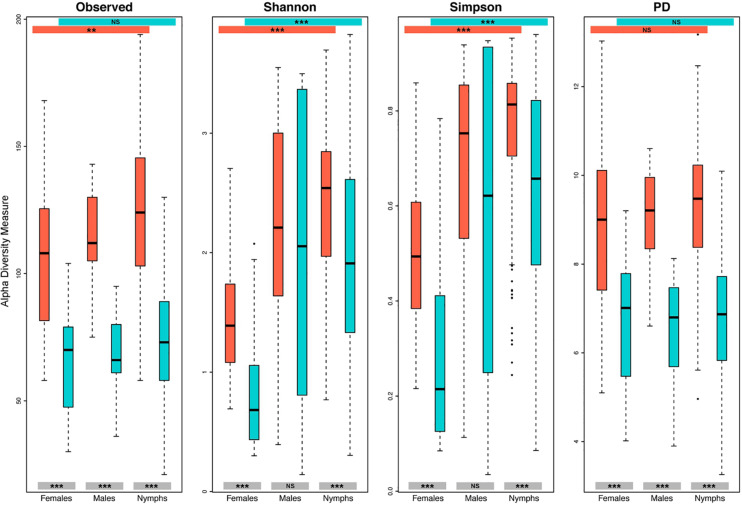
FIGURE 4.
Impact of contamination on alpha diversity estimations according to the tick instars. Alpha diversity has been estimated according to the observed number of OTUs, the Shannon and Simpson indexes and the Faith’s phylogenetic diversity (PD), for each instar on filtered (turquoise) and not filtered (orange-red) datasets. Results of the statistical test comparing alpha diversity measurement between instars, as well as between the filtered and not filtered groups, are represented on colored bands at both the top and the bottom of the frame, respectively. NS, not significant, ***p < 0.001, **p < 0.01.

