FIGURE 3.

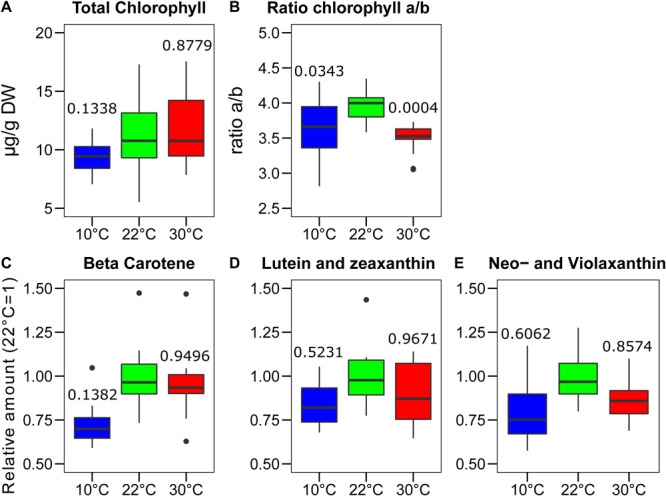
Changes in pigments content after the growth of Lepidium sativum at different temperatures. The chlorophyll content was measured in a sample constituted of two leaves collected from different plants grown in the same condition. (A) Content in total chlorophyll measured after the growth at three different temperatures normalized on the leaf dry weight. (B) Chlorophyll a/b ratio measured in the same samples shown in (A) (n = 15). Carotenoids analysis was performed by chromatography coupled with mass spectrometry (n = 11). The values are reported in terms of differences from the average value at 22°C for (C) Beta-carotene, (D) Lutein and zeaxanthin, and (E) neoxanthin and violaxanthin. The carotenoids in the blots (D) and (E) were indistinguishable in time or m/z and therefore are plotted as the sum of the two. In the box plots, the lower and upper hinges correspond to the first and third quartiles (the 25th and 75th percentiles). The whiskers extend from the hinge to the farthest value no further than 1.5 times the distance between the first and third quartiles from the hinge. Farther points are considered as “outliers” and plotted individually. The p-value derived from a post hoc test comparing the data with the value at 22°C is shown above each box.
