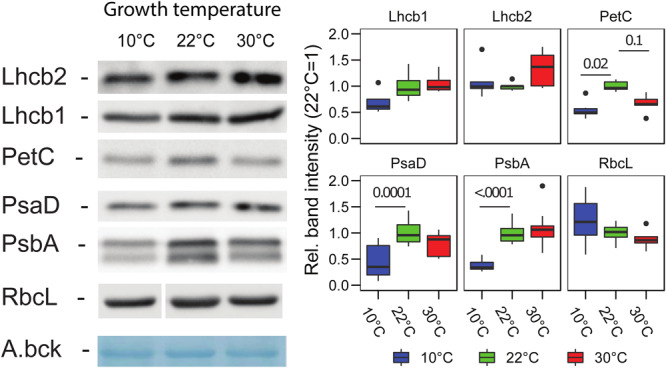
FIGURE 4.

Photosynthetic protein accumulation in Lepidium sativum at different growth temperatures. Representative proteins for the complexes of the electron transport chain, PSII (PsbA), PSI (PsaD), Cytb6f (PetC), and LHCII (Lhcb1, Lhcb2) were analyzed by immunodetection in samples normalized on fresh weight. A representative blot is shown for each protein along with a representative band of the total transferred proteins stained with amido black (A.bck) as a protein loading control. The box plots show the band intensity, normalized over the total amido black lane staining, compared to the control condition (22°C) (average intensity 22°C = 1). PSII (PsbA/D1) (n = 9), PSI (PsaD) (n = 9), Cytb6f (PetC) (n = 6), LHCII (Lhcb2) (n = 5), Lhcb1 (n = 4), and RbcL (n = 6). In the box plots, the lower and upper hinges correspond to the first and third quartiles (the 25th and 75th percentiles). The whiskers extend from the hinge to the farthest value no further than 1.5 times the distance between the first and third quartiles from the hinge. Farther points are considered as “outliers” and plotted individually.
