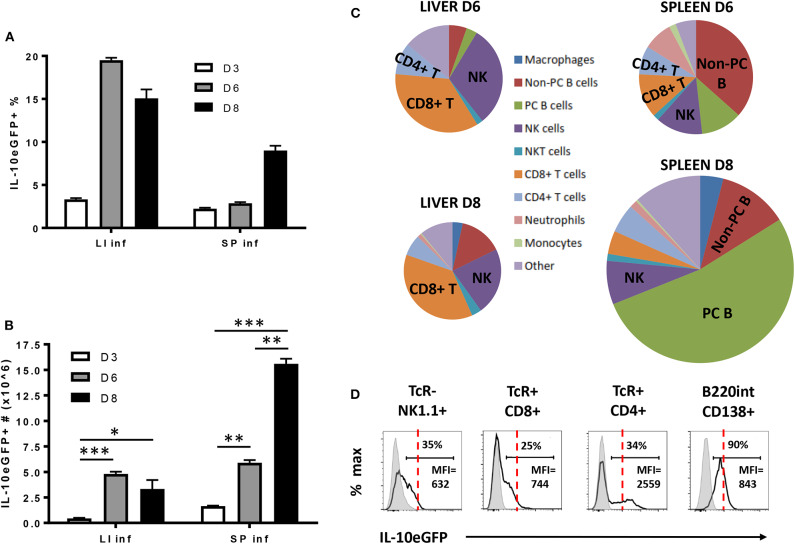
Figure 4.
Cellular characterization of IL-10 producing cells in spleen and liver following T. brucei infection. (A) Percentages and (B) total cell number of IL-10 producing cells in infected liver (LI inf) and spleen (SP inf) at day 3, 6, and 8 p.i. (C) Relative contribution of the different cellular sources producing IL-10. The surface of the diagram is representative of the total number of IL-10+ cells present in liver and spleen at day 6 and day 8 p.i., which is described in (B). (D) Histogram showing the intensity of IL-10-eGFP signal as well as the percentage and MFI of IL-10+ cells in different cell subsets. The red dotted line is giving an indication of the relative IL-10-eGFP signal differences between the different cell subsets, whereas the gray histogram represent the relative IL-10-eGFP signal of these different cell subsets in infected non-reporter mice. Data are represented as mean of at least three mice per group ± SEM, where *p ≤ 0.05, **p ≤ 0.01, ***p ≤ 0.001, and are representative of 3 independent experiments.

