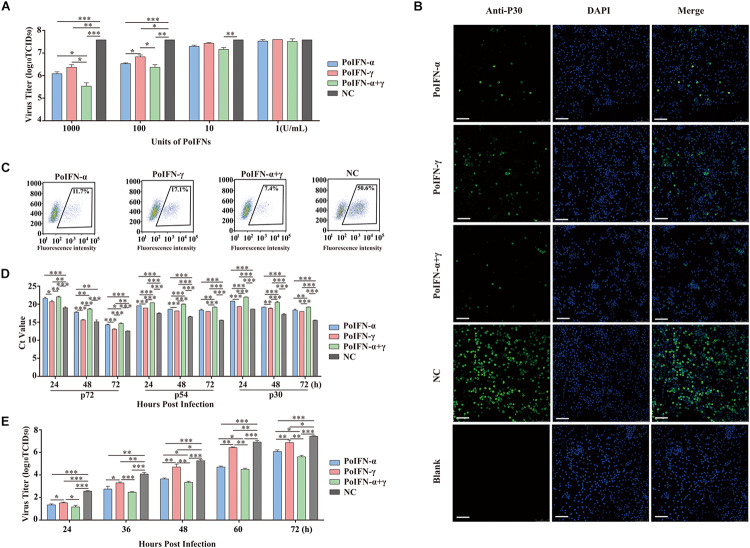
FIGURE 1.
PoIFN-α and PoIFN-γ inhibit the replication of African swine fever virus (ASFV) in primary alveolar macrophages (PAMs). (A) IFN inhibited virus replication. Primary alveolar macrophages were stimulated with PoIFN-α and PoIFN-γ at the indicated concentrations for 12 h in 24-well plates, and then the cells were infected with ASFV strain SY18 for 1 h at an MOI of 1. After removing the virus, PAMs were further cultured for 72 h prior to sample collection. (B) Indirect immunofluorescence analysis of anti-P30 expression in PAMs. The cells were exposed to a concentration of 1000 U/mL PoIFN-α, PoIFN-γ, or those combined for 12 h prior to infection with ASFV strain 18 for 1 h at an MOI of 1, maintained for 72 h after adsorption without PoIFN-α or PoIFN-γ, washed, and fixed with 4% paraformaldehyde. P30 expression was detected with a rabbit polyclonal antibody and FITC-conjugated AffiniPure Goat Anti-Rabbit IgG (H + L), and the nucleus was stained with DAPI. Scale bars represent 75 μm. (C) The antivial of IFNs against ASFV by immunoblot analysis. The PAM cells were treated with IFNs and then were infected with SY18 and collected for indirect immunofluorescence 48 h after infection. Next step, flow cytometric were used to analyze the proportion of fluorescent cells. 104 cells were selected and the number of fluorescent cells was counted for the purpose of counting the proportion of fluorescent cells. (D) The effect of PoIFN-α and PoIFN-γ on ASFV replication in PAMs detected by TaqMan qPCR methods. Primary alveolar macrophages were exposed to a fixed optimal concentration of 1000 U/mL PoIFN-α, PoIFN-γ, or those combined for 12 h prior to infection with SY18 for 1 h at an MOI of 1 and maintained for different times after adsorption without PoIFN-α or PoIFN-γ; the ASFV P72 Ct value of different groups at the indicated time points was determined. (E) Growth curve of SY18 in PAMs. Primary alveolar macrophages were exposed to a fixed optimal concentration of 1000 U/mL PoIFN-α, PoIFN-γ, or those combined for 12 h prior to infection with SY18 for 1 h at an MOI of 1 and maintained for different times after adsorption without PoIFN-α or PoIFN-γ, and the virus titer was determined in PAMs by TCID50 assays. Three replicates were performed for all analyses. Bars represent the means ± SD (n = 3). The data of 0 h detection point is not shown. A non-parametric test was used for the difference significance analysis. Statistically significant differences are indicated (∗P < 0.05; ∗∗P < 0.01; ∗∗∗P < 0.001) and the line above the column marks the two groups with differences.

