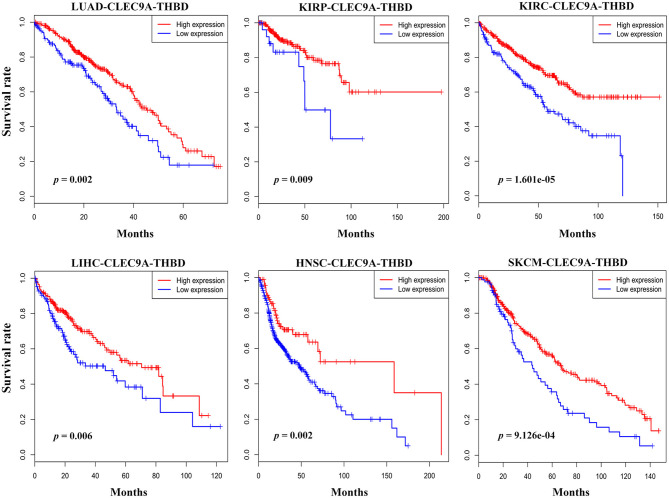
Figure 1.
Prognostic implications of BDCA3+ (CD141+) DC signatures in several types of cancer. The geometric average of CLEC9A and THBD's expression of patients from TCGA cohorts was calculated and used as the BDCA3+ (CD141+) DC signature. Survival proportions were assessed in lung adenocarcinoma (LUAD), kidney renal papillary cell carcinoma (KIRP), kidney renal clear cell carcinoma (KIRC), liver hepatocellular carcinoma (LIHC), head and neck squamous cell carcinoma (HNSC), and skin cutaneous melanoma (SKCM) by Kaplan-Meier analysis paired with Log-rank test (Log-rank test p < 0.05 as a significant statistical significance). The red curve represents high BDCA3+ (CD141+) DC signature, and the blue curve represents low BDCA3+ (CD141+) DC signature. The best cutoffs are determined by X-tile software. The TCGA clinical data were downloaded from the data portal of the Genomic Data Commons (GDC), where all TCGA molecular data are also available (https://portal.gdc.cancer.gov).

