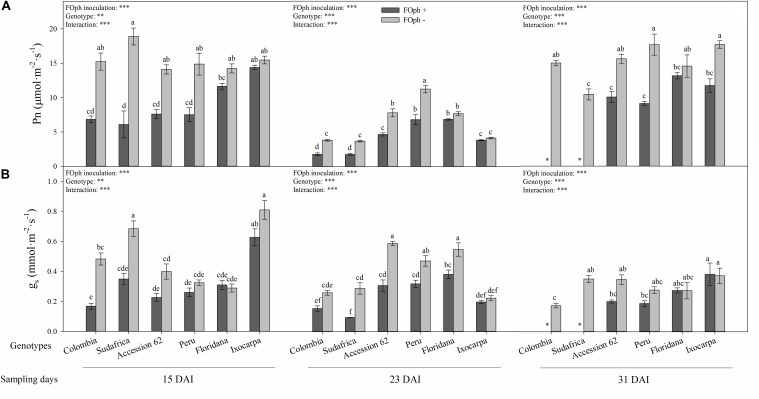
FIGURE 3.
Photosynthesis (Pn; A) and stomatal conductance (gs; B) of six cape gooseberry genotypes [Colombia, Sudafrica, Accession 62, Peru, Physalis floridana (Floridana), and Physalis ixocarpa (Ixocarpa)] with (dark gray bars) or without (light gray bars) Fusarium oxysporum f. sp. physali (FOph) inoculation at three different sampling points [15, 23, and 31 days after inoculation (DAI)]. Each column represents the mean of five data ± standard error (n = 5). Bars followed by different letters indicate statistically significant differences according to the Tukey test (P ≤ 0.05). ∗Means that the photosynthesis and stomatal conductance were not determined due to the death of the genotype because of the pathogen. p-Values of the ANOVA of genotypes, FOph inoculation and their interaction are indicated as ∗∗p < 0.01, and ∗∗∗p < 0.001.

