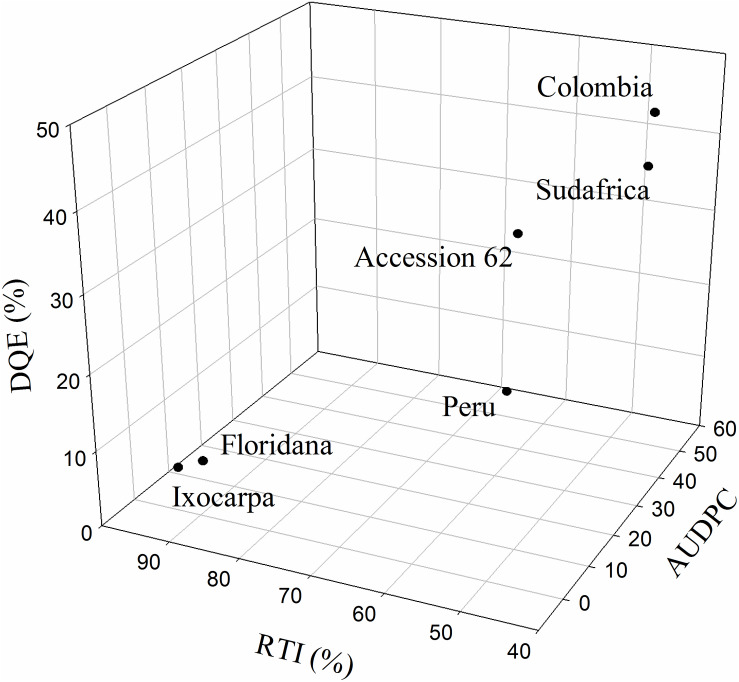
FIGURE 8.
Three-dimensional plot [area under the disease progress curve (AUDPC), decrease in the maximum efficiency of PSII (DQE), and relative tolerance index (RTI)] for six cape gooseberry genotypes [Colombia, Sudafrica, Accession 62, Peru, Physalis floridana (Floridana), and Physalis ixocarpa (Ixocarpa)] inoculated with Fusarium oxysporum f. sp. physali (FOph) at 23 days after inoculation (DAI). Data represents the mean of five data ± standard error (n = 5).

