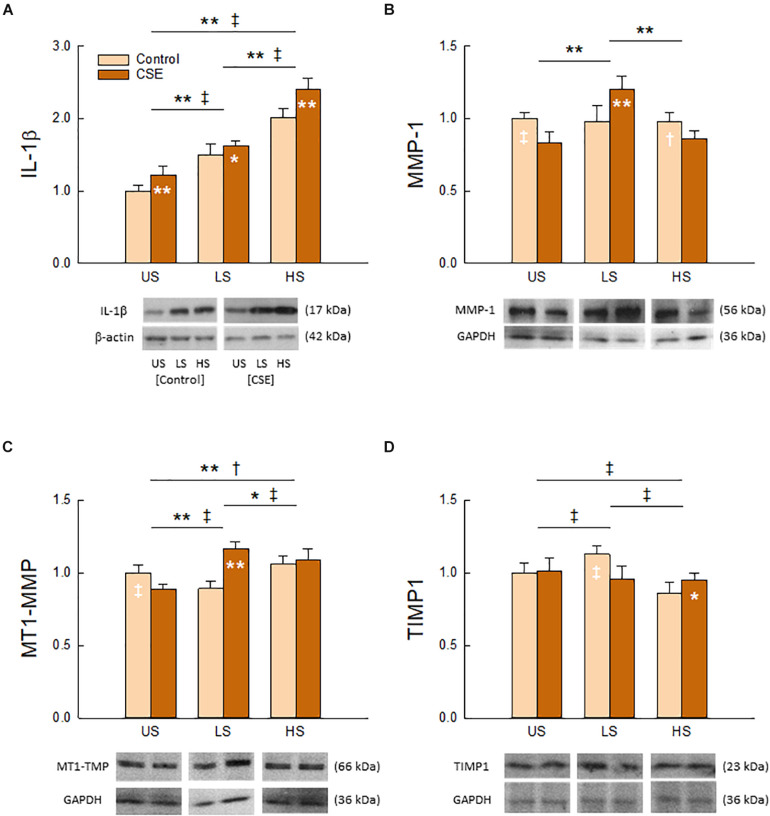
FIGURE 5.
Effects of stretch pattern, CSE, and their interaction on tissue content of IL-1β (A), MMP-1 (B), MT1-MMP (C), and TIMP1 (D). Representative bands with loading controls are also shown. Data (N = 8) are shown as normalized mean and SD (*†p < 0.05 and **‡p < 0.001 for CSE and Control groups, respectively). For presentation purposes the original images were cut to smaller ones including representative bands in the desired order and, according to standard publication guideless, white spaces were left between them.

