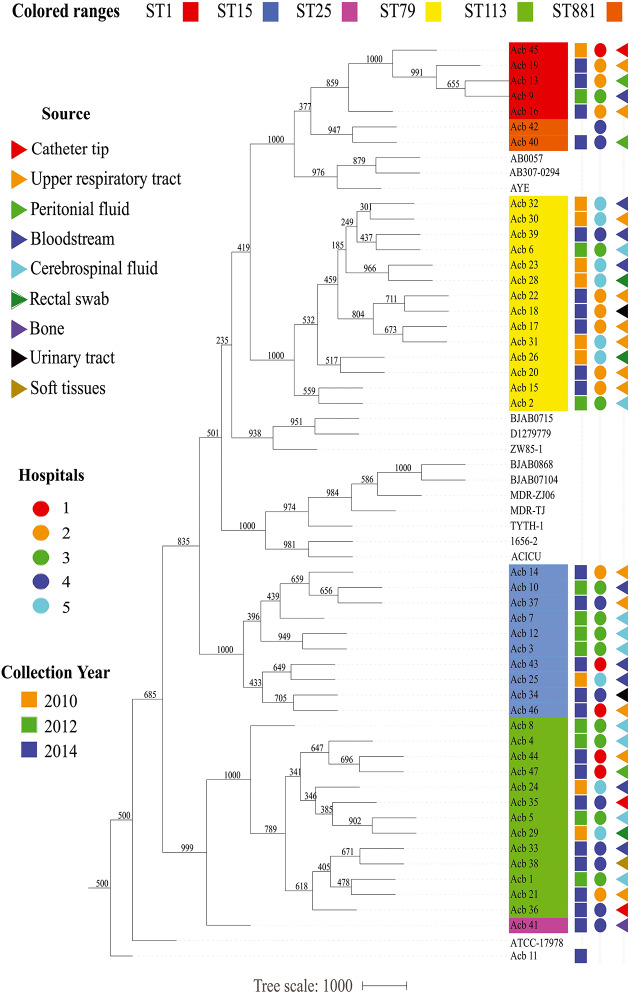
FIGURE 2.
Epidemiological features of the Acinetobacter strains characterized in this study. The source of the bacterial samples, the hospitals from where the strains were isolated and the year of sample collections are displayed at the right and represented by colored triangles, circles or squares, respectively. A phylogenetic tree comparing all strains sequenced here, and with selected reference genomes, is included in the right, color coded as in Figure 1.

