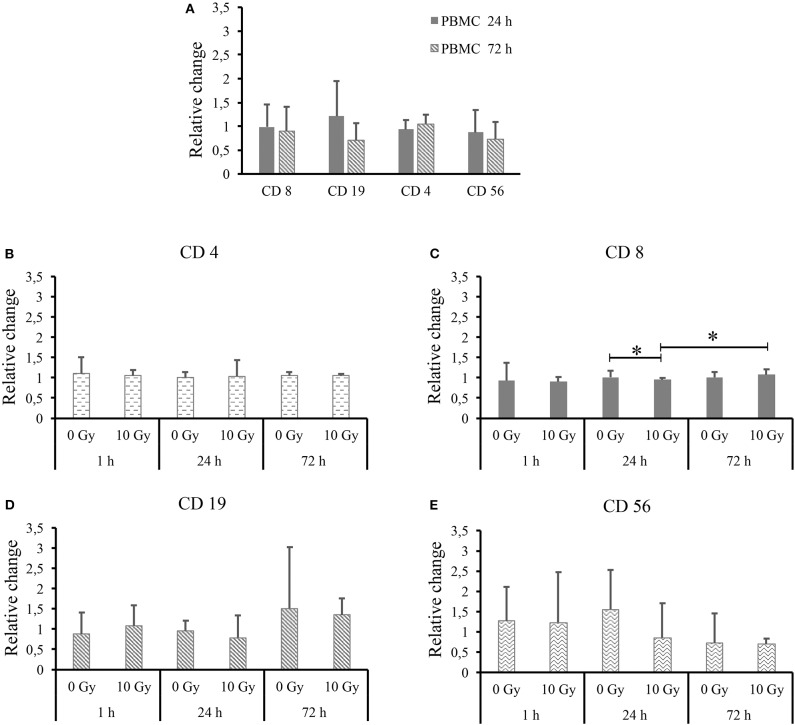
Figure 4.
Average relative changes in PBMC subset populations for all donors. (A) For PBMCs cultured alone, relative changes in CD4+, CD8+, CD19+, and CD56+ subsets as a function of time with respect to the 1 h time-point. For PBMCs co-cultured with both non-irradiated and 10 Gy-irradiated Caco-2 cells, relative changes with respect to PBMCs cultured alone at the same time-point for subsets: (B) CD4+; (C) CD8+; (D) CD19+; and (E) CD56+. Ratios are calculated for individual donors (excluding outliers identified in Figure 3) and then averaged. Errors are obtained as standard deviations. Statistical significance (p < 0.05) is calculated by two-tailed Student's t-test.

