
Figure 4.
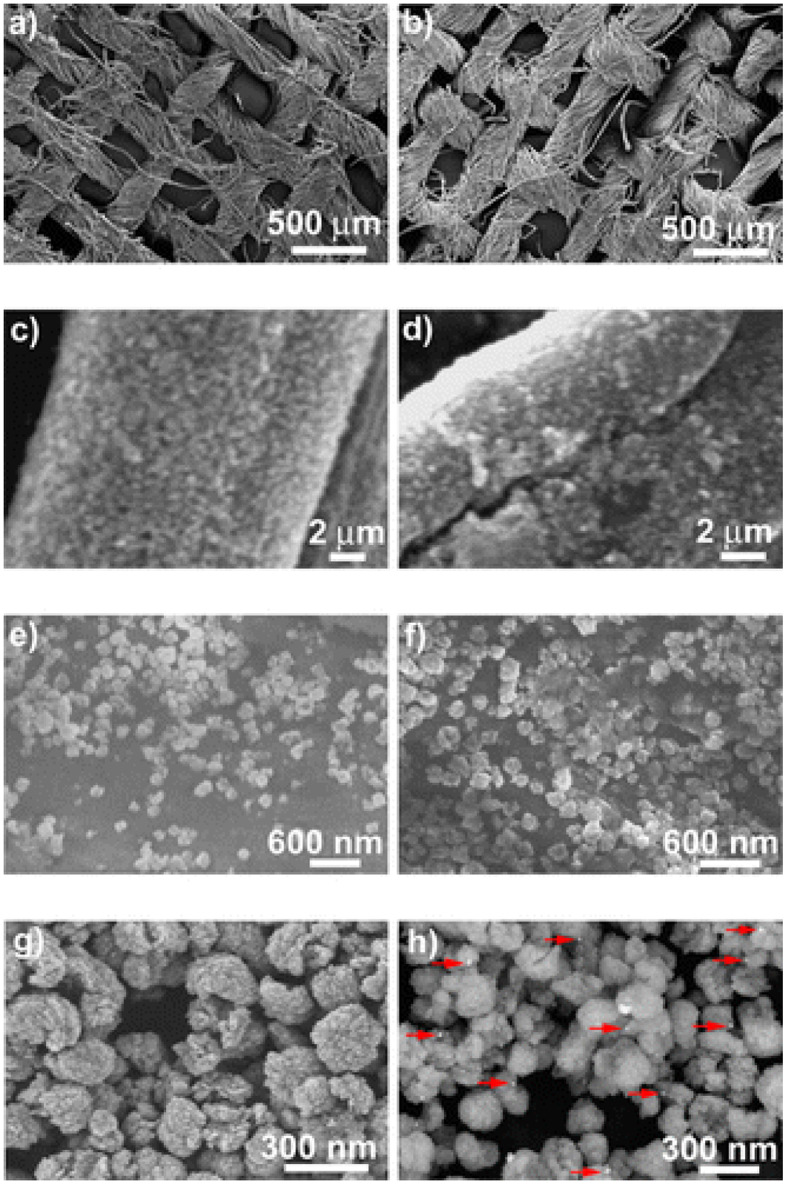
Scanning electron microscopy (SEM) images taken at different magnifications for the cotton fabrics (a,c,e) ZnO@CF and (b,d,f) Ag@ZnO@CF-2.5; field emission SEM (FESEM) images depicting (g) ZnO and (h) Ag@ZnO particles. The red arrows indicate Ag nanoparticles. Reproduced from Manna et al. (2015) with permission from the American Chemical Society.