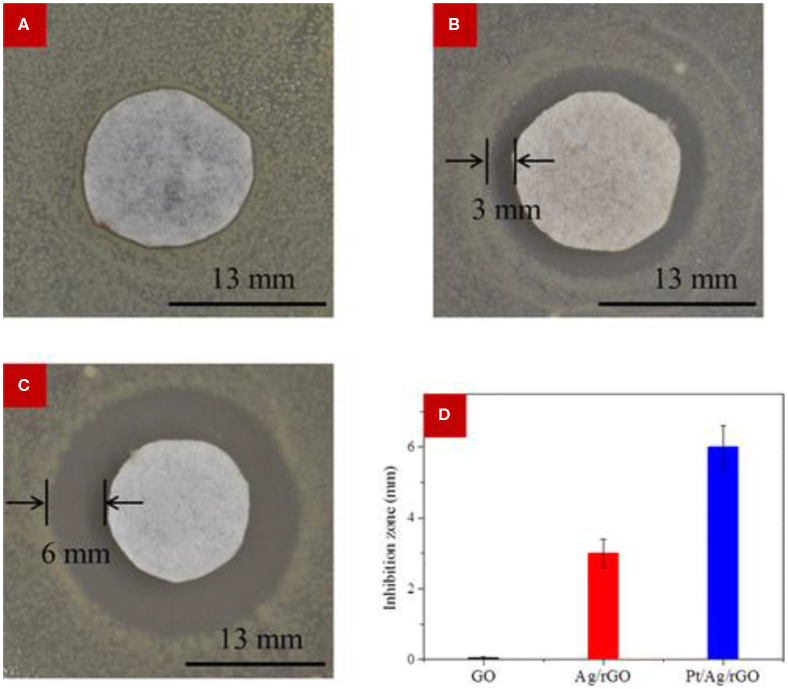
Figure 6.
Antimicrobial activity measurement using the modified Kirby–Bauer method. (A–C) Optical images of bacterial colonies against E. coli corresponding to (A) GO, (B) Ag/rGO, and (C) Pt/Ag/rGO. The Pt/Ag/rGO sample exhibited the largest inhibition zone. (D) Comparisons of the radius of the inhibition zone of bacteria treated with the different samples, revealing superior performance of the bimetallic material. Error bar is based on the average of three measurements. Reproduced from Zhang et al. (2016a) with permission from the American Chemical Society.

