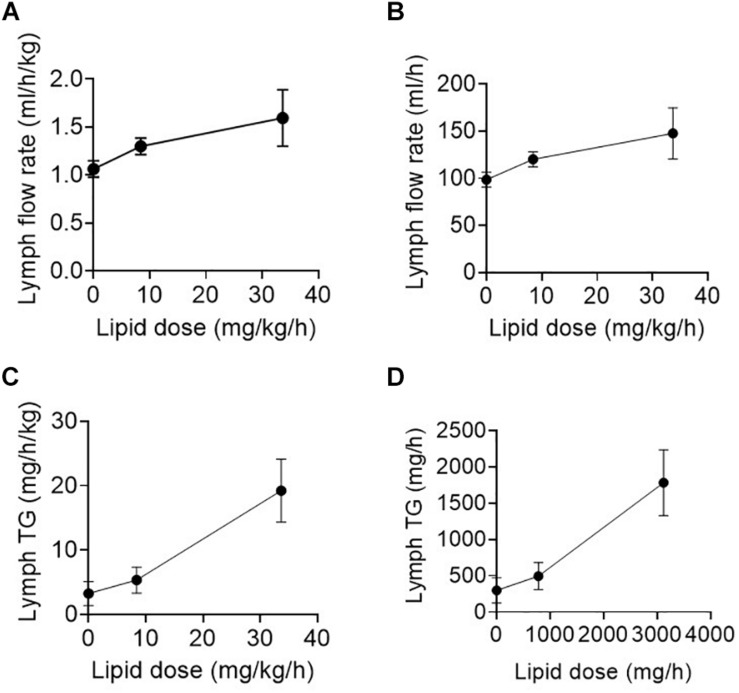
FIGURE 1.
(A,B) Lymph flow rate (in ml/h/kg or ml/h) and (C,D) Lymph triglyceride (TG) transport rate (in mg/h/kg or mg/h) versus enteral lipid dose (in mg/h or mg/h/kg) in human patients infused with 0, 20, or 80 ml/h of enteral nutrition containing different lipid (TG) doses. Data shown are mean ± SEM for 19, 9, and 6 replicates from n = 3, 3, and 2 patients administered 0, 20, and 80 ml/h enteral nutrition, respectively.

