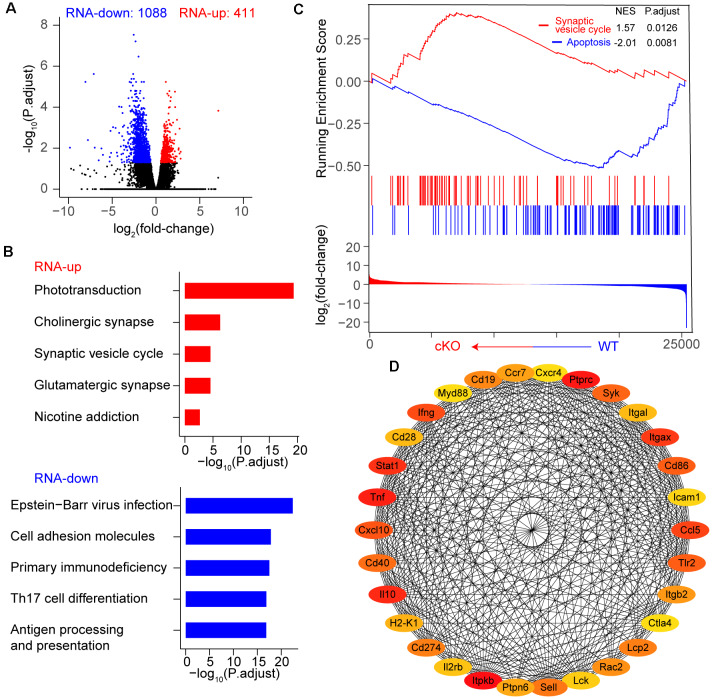
Figure 3.
Transcriptome dynamic changes of RGCs after Arid1a deletion. (A) Volcano plot of log2 (fold-change) vs. –log10 (P.adjust) representing gene expression changes between WT and Arid1a cKO RGCs. (B) Kyoto encyclopedia of genes and genomes (KEGG) analysis of these differentially expressed genes in (A), the terms with the five highest –log10 (P.adjust) are shown as a bar plot. (C) Gene set enrichment analysis (GSEA)-KEGG pathway analysis of RNA-seq data. (D) The protein-protein interactions of differentially expressed genes, only the 30 genes with the highest degree (low values to dark colors) are shown in a circular layout.

