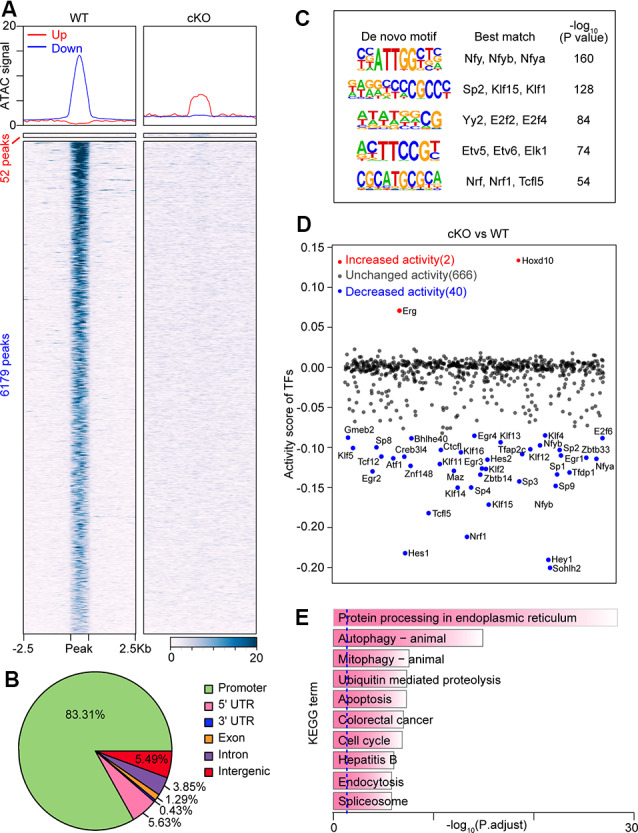
Figure 4.

Loss of Arid1a leads to disturbed chromatin accessibility and binding of transcription factors (TFs) in RGCs. (A) Average profiles and heatmaps of chromatin accessibility within ±2.5 kb of groups of peaks. Up and Down: peaks with increased and decreased chromatin accessibility after Arid1a deletion in RGCs separately. (B) Pie chart showing the distribution of peaks with reduced ATAC signal caused by Arid1a loss at annotated genomic regions. (C) Sequence logos corresponding to enriched elements identified by de novo motif analysis of peaks with a decrease in chromatin accessibility at the promoter regions after Arid1a deletion in RGCs. (D) Scatter plot showing changes of TFs’ activity predicated using ATAC-seq data after Arid1a deletion in RGCs. (E) KEGG pathway enrichment analysis of genes annotated in these peaks defined in (C).
