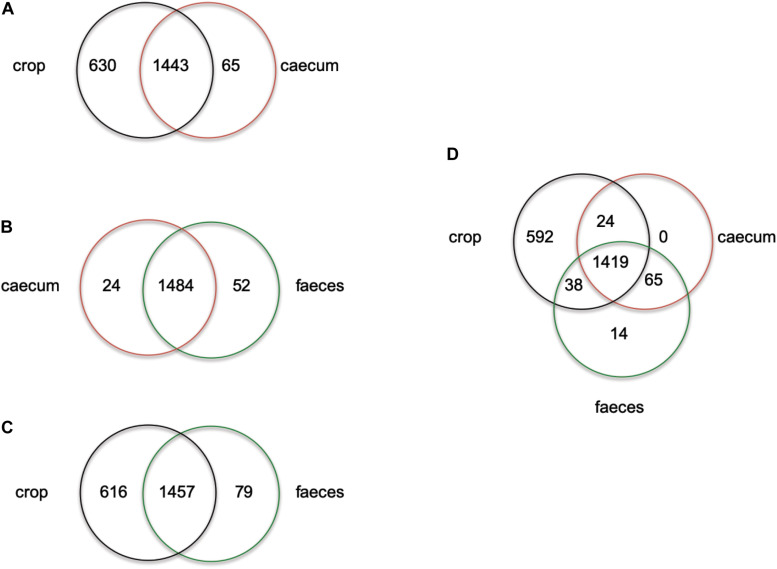
FIGURE 1.
Venn diagram showing the number of unique or shared genes between L. reuteri chicken isolates from crop vs. cecum (A), cecum vs. feces (B), crop vs. feces (C) and cecum vs. feces vs. crop (D). Individual unique genes of crop isolates, in each comparison, are listed in Supplementary Table S2 in alphabetic order.

